blog posts and news stories

ESSA’s Evidence Tiers and Potential for Bias

This is the second of a four-part blog posting about changes needed to the legacy of NCLB to make research more useful to school decision-makers. Here we explain how ESSA introduced flexibility and how NCLB-era habits have raised issues about bias. (Read the first one here.)

The tiers of evidence defined in the Every Student Succeeds Act (ESSA) give schools and researchers greater flexibility, but are not without controversy. Flexibility creates the opportunity for biased results. The ESSA law, for example, states that studies must statistically control for “selection bias”, recognizing that teachers who “select” to use a program may have other characteristics that give them an advantage and the results for those teachers could be biased upward. As we trace the problem of bias it is useful to go back to the interpretation of ESSA that originated with the NCLB-era approach to research.

When we helped develop the research guidelines for the Software & Information Industry Association, we took a close look at ESSA and how it is often interpreted. Now, as research is evolving with cloud-based educational products that automatically report usage data, it is important to clarify both ESSA’s useful advances and how the four tiers fail to address a critical scientific concept needed for schools to make use of research.

We’ve written elsewhere how the ESSA tiers of evidence form a developmental scale. The four tiers give educators as well as developers of educational materials and products an easier way to start examining effectiveness without making the commitment to the type of scientifically-based research that NCLB once required.

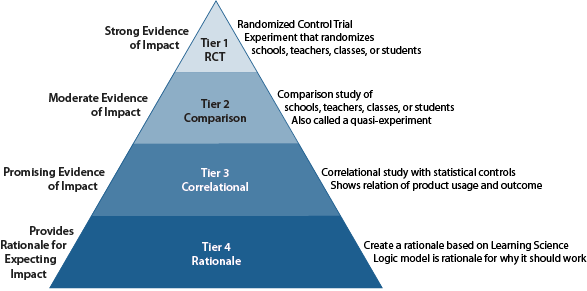
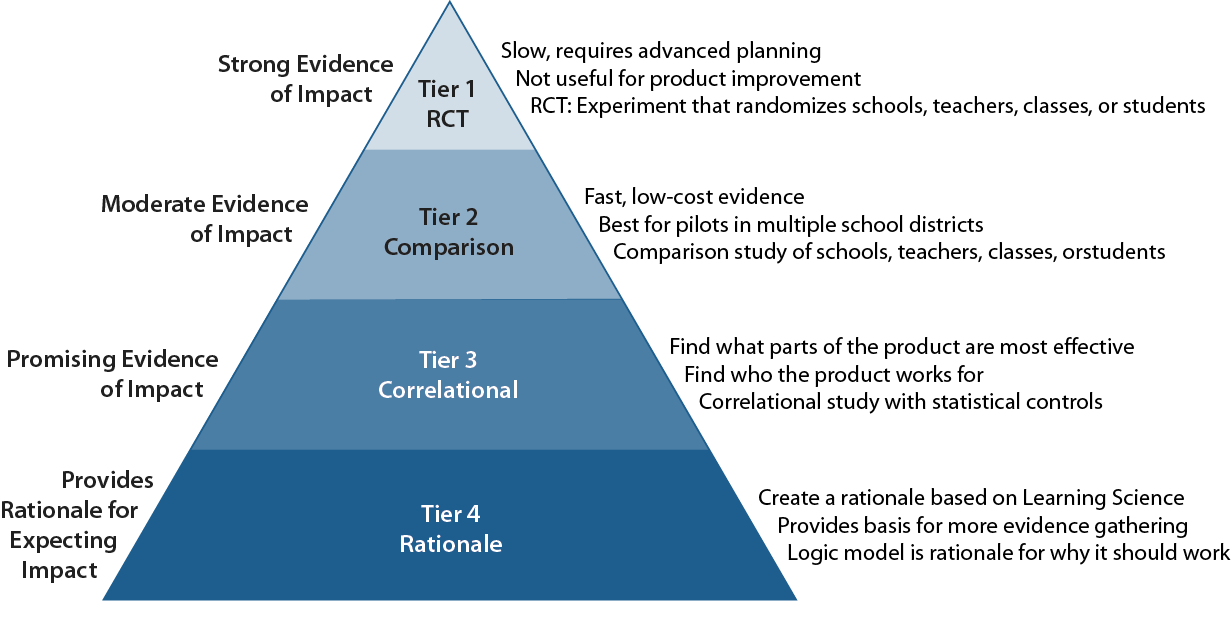
We think of the four tiers of evidence defined in ESSA as a pyramid as shown in this figure.

ESSA levels of evidence pyramid

  1. RCT. At the apex is Tier 1, defined by ESSA as a randomized control trial (RCT), considered the gold standard in the NCLB era.
  2. Matched Comparison or “quasi-experiments”. With Tier 2 the WWC also allowed for less rigorous experimental research design, such as matched comparisons or quasi-experiments (QE) where schools, teachers, and students (experimental units) independently chose to engage in the program. QEs are permitted but accepted “with reservations” because without random assignment there is the possibility of “selection bias.” For example, teachers who do well at preparing kids for tests might be more likely to participate in a new program than teachers who don’t excel at test preparation. With an RCT we can expect that such positive traits are equally distributed in the experiment between users and non-users.
  3. Correlational. Tier 3 is an important and useful addition to evidence, as a weaker but readily achieved method once the developer has a product running in schools. At that point, they have an opportunity to see if critical elements of the program correlate with outcomes of interest. This provides promising evidence, which is useful for both improving the product and giving the schools some indication that it is helping. This evidence suggests that it might be worthwhile to follow up with a tier 2 study for more definitive results.
  4. Rationale. The base level or Tier 4 is the expectation that any product should have a rationale based on learning science for why it is likely to work. Schools will want this basic rationale for why a program should work before trying it out. Our colleagues at Digital Promise have announced a service in which developers are certified as meeting Tier 4 standards.

Each subsequent tier of evidence (from number 4 to 1) improves what’s considered the “rigor” of the research design. It is important to understand that the hierarchy has nothing to do with whether the results can be generalized from the setting of the study to the district where the decision-maker resides.

While the NCLB-era focus on strong design puts emphasis on the Tier 1 RCT, we see Tiers 2 and 3 as an opportunity for lower cost and faster-turn-around “rapid-cycle evaluations” (RCE.) Tier 1 RCTs have given education research a well-deserved reputation as slow and expensive. It can take one to two years to complete an RCT, with additional time needed for data collection, analysis, and reporting. This extensive work also includes recruiting districts that are willing to participate in the RCT and often puts the cost of the study in the millions of dollars. We have conducted dozens of RCTs following the NCLB-era rules, but advocate less expensive studies in order to get the volume of evidence schools need. In contrast to an RCT, an RCE can use existing data from a school system can be both faster and far less expensive.

There is some controversy about whether schools should use lower-tier evidence, which might be subject to “selection bias.” Randomized control trials are protected from selection bias since users and non-user are assigned randomly, whether they like it or not. It is well known and has been recently pointed out by Robert Slavin that using a matched comparison, a study where teachers chose to participate in the pilot of a product, can result in unmeasured variables, technically “confounders” that affect outcomes. These variables are associated with the qualities that motivate a teacher to pursue pilot studies and their desire to excel in teaching. The comparison group may lack these characteristics that help the self-selected program users succeed. Studies of Tiers 2 and 3 will always have, by definition, unmeasured variables that may act as confounders.

While obviously a concern, there are ways that researchers can statistically control important characteristics associated with selection to use a program. For example, the amount of a teacher’s motivation to use edtech products can be controlled by collecting information from the prior year on the amount of usage by the teacher and students of a full set of products. Past studies looking at the conditions under which there is correspondence between results of RCTs and matched comparison studies that evaluate the impact of a given program have established that it is exactly “focal” variables such as motivation, that are influential confounders. Controlling for a teacher’s demonstrated motivation and students’ incoming achievement may go very far in adjusting away bias. We suggest this in a design memo for a study now being undertaken. This statistical control meets the ESSA requirement for Tiers 2 and 3.

We have a more radical proposal for controlling all kinds of bias that we address in the next posting in this series.

2020-06-22

Agile Assessment and the Impact of Formative Testing on Student Achievement in Algebra

Empirical Education contracted with Jefferson Education Accelerator (JEA) to conduct a study on the effectiveness of formative testing for improving student achievement in Algebra. We partnered with a large urban school district in the northeast U.S. to evaluate their use of Agile Assessment. Developed by experts at the Charles A Dana Center at the University of Texas and education company Agile Mind, Agile Assessment is a flexible system for developing, administering, and analyzing student assessments that are aligned by standard, reading level, and level of difficulty. The district used benchmark Agile Assessments in the fall, winter, and spring to assess student performance in Algebra along with a curriculum it had chosen independent of assessments.

We conducted a quasi-experimental comparison group study using data from the 2016-17 school year and examined the impact of Agile Assessment usage on student achievement for roughly 1,000 students using the state standardized assessment in Algebra.

There were three main findings from the study:

  1. Algebra scores for students who used Agile Assessment were better than scores of comparison students. The result had an effect size of .30 (p = .01), which corresponds to a 12-percentile point gain, adjusting for differences in student demographics and pretest between treatment and comparison students.
  2. The positive impact of Agile Assessment generalized across many student subgroups, including Hispanic students, economically disadvantaged students and special education students.
  3. Outcomes on the state Algebra assessment were positively associated with the average score on the Agile Assessment benchmark tests. That said, adding the average score on Agile Assessment benchmark tests to the linear model increased its predictive power by a small amount.

These findings provide valuable evidence in favor of formative testing for the district and other stakeholders. Given disruptions in the current public school paradigm, increased frequency of formative assessment could provide visibility towards greater personalized instruction and ultimately increase student outcomes. You can read the full research report here.

2020-06-17

Ending a Two-Decade-Old Research Legacy

This is the first of a four-part blog posting about changes needed to the legacy of NCLB to make research more useful to school decision-makers. This post focuses on research methods established in the last 20 years and the reason that much of that research hasn’t been useful to schools. Subsequent posts will present an approach that works for schools.

With the COVID-19 crisis and school closures in full swing, use of edtech is predicted to not just continue, but expand when the classrooms they have replaced come back in use. There is little information available about which edtech products work for whom and under what conditions and the lack of evidence is noted. As a research organization specializing in rigorous program evaluations, Empirical Education, working with Evidentally, Inc., has been developing methods for providing schools with useful and affordable information.

The “modern” era of education research was established with No Child Left Behind, the education law passed in 2002, which established the Institute of Education Sciences (IES). The declaration of “scientifically-based research” in NCLB sparked a major undertaking assigned to the IES. To meet NCLB’s goals for improvement, it was essential to overthrow education research methods that lacked the practical goal of determining whether programs, products, practices, or policies moved the needle for an outcome of interest. These outcomes could be test scores or other measures, such as discipline referrals, that the schools were concerned with.

The kinds of questions that the learning sciences of the time answered were different: for example, how can we compare tests with tasks outside of the test? Or what is the structure of the classroom dialogue? Instead of these qualitative methods, IES looked to the medical field and other areas of policy like workforce training where randomization was used to assign subjects to a treatment group and a control group. Statistical summaries were then used to decide whether the researcher can reasonably conclude that a difference of the magnitude observed is big enough that it is unlikely to happen without a real effect.

In an attempt to mimic the medical field, IES set up the What Works Clearinghouse (WWC), which became the arbiter of acceptable research. WWC focused on getting the research design right. Many studies would be disqualified, with very few, and sometimes just one, meeting design requirements considered acceptable to provide valid causal evidence. This led to the idea that all programs, products, practices, or policies needed at least one good study that would prove its efficacy. The focus on design (or “internal validity”) was to the exclusion of generalizability (or “external validity”). Our team has conducted dozens of RCTs and appreciates the need for careful design. But we try to keep in mind the information that schools need.

Schools need to know whether the current version of the product will work, when implemented using district resources and with its specific student and teacher populations. A single acceptable study may have been conducted a decade ago with ethnicities different from the district that is looking for evidence of what will work for them. The WWC has worked hard to be fair to each intervention, especially where there are multiple studies that meet their standards. But, the key is that each separate study comes with an average conclusion. While the WWC notes the demographic composition of the subjects in the study, difference results for subgroups when tested by the study are considered secondary.

The Every Student Succeeds Act (ESSA) was passed with bi-partisan support in late 2015 and replaced NCLB. ESSA replaced scientifically-based research required by NCLB with four evidence tiers. While this was an important advance, ESSA retained the WWC as providing the definition of the top two tiers. The WWC, which remains the arbiter of evidence validity, gives the following explanation of the purpose of the evidence tiers.

“Evidence requirements under the Every Student Succeeds Act (ESSA) are designed to ensure that states, districts, and schools can identify programs, practices, products, and policies that work across various populations.”

The key to ESSA’s failings is in the final clause: “that work across various populations.” As a legacy of the NCLB-era, the WWC is only interested in the average impact across the various populations in the study. The problem is that district or school decision-makers need to know if the program will work in their schools given their specific population and resources.

The good news is that the education research community is recognizing that ignoring the population, region, product, and implementation differences is no longer necessary. Strict rules were needed to make the paradigm shift to the RCT-oriented approach. But now that NCLB’s paradigm has been in place for almost two decades, and generations of educational researchers have been trained in it, we can broaden the outlook. Mark Schneider, IES’s current director, defines the IES mission as being “in the business of identifying what works for whom under what conditions.” This framing is a move toward a broader focus with more relevant results. Researchers are looking at how to generalize results; for example, the Generalizer tool developed by Tipton and colleagues uses demographics of a target district to generate an applicability metric. The Jefferson Education Exchange’s EdTech Genome Project has focused on implementation models as an important factor in efficacy.

Our methods move away from the legacy of the last 20 years to lower the cost of program evaluations, while retaining the scientific rigor and avoiding biases that give schools misleading information. Lowering cost makes it feasible for thousands of small local studies to be conducted on the multitude of school products. Instead of one or a small handful of studies for each product, we can use a dozen small studies encompassing the variety of contexts so that we can determine for whom and under what conditions the product works.

Read the second part of this series next.

2020-06-02

Updating Evidence According to ESSA

The U.S. Department of Education (ED) sets validity standards for evidence of what works in schools through The Every Student Succeeds Act (ESSA), which provides usefully defined tiers of evidence.

When we helped develop the research guidelines for the Software & Information Industry Association, we took a close look at ESSA and how it is often interpreted. Now, as research is evolving with cloud-based online tools that automatically report usage data, it is important to review the standards and to clarify both ESSA’s useful advances and how the four tiers fail to address some critical scientific concepts. These concepts are needed for states, districts, and schools to make the best use of research findings.

We will cover the following in subsequent postings on this page.

  1. Evidence According to ESSA: Since the founding of the Institute of Education Sciences and NCLB in 2002, the philosophy of evaluation has been focused on the perfection of one good study. We’ll discuss the cost and technical issues this kind of study raises and how it sometimes reinforces educational inequity.
  2. Who is Served by Measuring Average Impact: The perfect design focused on the average impact of a program across all populations of students, teachers, and schools has value. Yet, school decision makers need to also know about the performance differences between specific groups such as students who are poor or middle class, teachers with one kind of preparation or another, or schools with AP courses vs. those without. Mark Schneider, IES’s director defines the IES mission as “IES is in the business of identifying what works for whom under what conditions.” This framing is a move toward a broader focus with more relevant results.
  3. Differential Impact is Unbiased. According to the ESSA standards, studies must statistically control for selection bias and other sources of bias. But biases that impact the average for the population in the study don’t impact the size of the differential effect between subgroups. The interaction between the program and the population characteristic is unaffected. And that’s what the educators need to know about.
  4. Putting many small studies together. Instead of the One Good Study approach we see the need for multiple studies each collecting data on differential impacts for subgroups. As Andrew Coulson of Mind Research Institute put it, we have to move from the One Good Study approach and on to valuing multiple studies with enough variety to be able to account for commonalities among districts. We add that meta-analysis of interaction effects are entirely feasible.

Our team works closely with the ESSA definitions and has addressed many of these issues. Our design for an RCE for the Dynamic Learning Project shows how Tiers 2 and 3 can be combined to answer questions involving intermediate results (or mediators). If you are interested in more information on the ESSA levels of evidence, the video on this page is a recorded webinar that provides clarification.

2020-05-12

Empirical Describes Innovative Approach to Research Design for Experiment on the Value of Instructional Technology Coaching

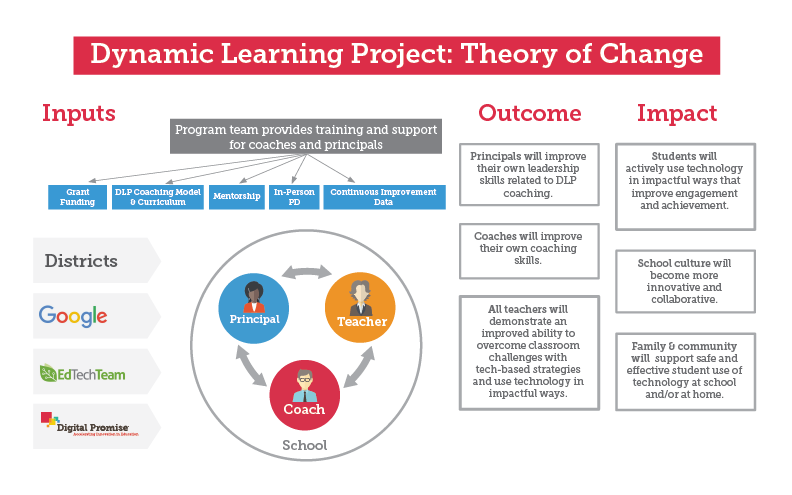
Empirical Education (Empirical) is collaborating with Digital Promise to evaluate the impact of the Dynamic Learning Project (DLP) on student achievement. The DLP provides school-based instructional technology coaches to participating districts to increase educational equity and impactful use of technology. Empirical is working with data from prior school years, allowing us to continue this work during this extraordinary time of school closures. We are conducting quasi-experiments in three school districts across the U.S. designed to provide evidence that will be useful to DLP stakeholders, including schools and districts considering using the DLP coaching model. Today, Empirical has released its design memo outlining its innovative approach to combining teacher-level and student-level outcomes through experimental and correlational methods.

Digital Promise— through funding and partnership with Google—launched the DLP in 2017 with more than 1,000 teachers in 50 schools across 18 districts in five states. The DLP expanded in the second year of implementation (2018-2019) with more than 100 schools reached across 23 districts in seven states. Digital Promise’s surveys of participating teachers have documented teachers’ belief in the DLP’s ability to improve instruction and increase impactful technology use (see Digital Promise’s extensive postings on the DLP). Our rapid cycle evaluations will work with data from the same cohorts, while adding district administrative data and data on technology use.

Empirical’s studies will establish valuable links between instructional coaching, technology use, and student achievement, all while helping to improve future iterations of the DLP coaching model. As described in our design memo, the study is guided by Digital Promise’s logic model. In this model, coaching is expected to affect an intermediate outcome, measured in Empirical’s research in terms of patterns of usage of edtech applications, as they implicate instructional practices. These patterns and practices are then expected to impact measurable student outcomes. The Empirical team will evaluate the impact of coaching on both the mediator (patterns and practices) and the student test outcomes. We will examine student-level outcomes by subgroup. The data are currently in the collection process. To view the final report, visit our Digital Promise page.

2020-05-01

Updated Research on the Impact of Alabama’s Math, Science, and Technology Initiative (AMSTI) on Student Achievement

We are excited to release the findings of a new round of work conducted to continue our investigation of AMSTI. Alabama’s specialized training program for math and science teachers began over 20 years ago and now reaches over 900 schools across the state. As the program is constantly evolving to meet the demands of new standards and new assessment systems, the AMSTI team and the Alabama State Department of Education continue to support research to evaluate the program’s impact. Our new report builds on the work undertaken last year to answer three new research questions.

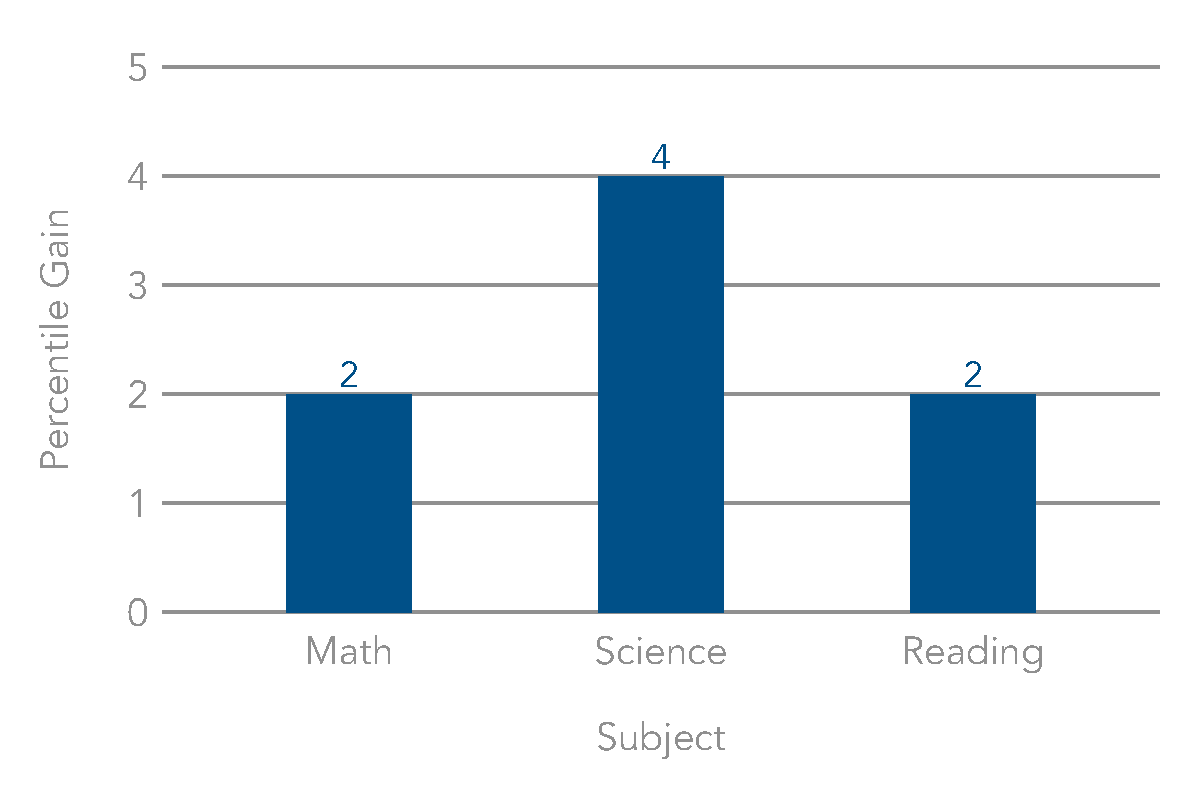
  1. What is the impact of AMSTI on reading achievement? We found a positive impact of AMSTI for students on the ACT Aspire reading assessment equivalent to 2 percentile points. This replicates a finding from our earlier 2012 study. This analysis used students of AMSTI-trained science teachers, as the training purposely integrates reading and writing practices into the science modules.
  2. What is the impact of AMSTI on early-career teachers? We found positive impacts of AMSTI for partially-trained math teachers and fully-trained science teachers. The sample of teachers for this analysis was those in their first three years of teaching, with varying levels of AMSTI training.
  3. How can AMSTI continue program development to better serve ELL students? Our earlier work found a negative impact of AMSTI training for ELL students in science. Building upon these results, we were able to identify a small subset of “model ELL AMSTI schools” where there was both a positive impact of AMSTI on ELL students, and where that impact was larger than any school-level effect on ELL students versus the entire sample. By looking at the site-specific best practices of these schools for supporting ELL students in science and across the board, the AMSTI team can start to incorporate these strategies into the program at large.

All research Empirical Education has conducted on AMSTI can be found on our AMSTI webpage.

2020-04-06

Report Released on the Effectiveness of SRI/CAST's Enhanced Units

Summary of Findings

Empirical Education has released the results of a semester-long randomized experiment on the effectiveness of SRI/CAST’s Enhanced Units (EU). This study was conducted in cooperation with one district in California, and with two districts in Virginia, and was funded through a competitive Investing in Innovation (i3) grant from the U.S. Department of Education. EU combines research-based content enhancement routines, collaboration strategies and technology components for secondary history and biology classes. The goal of the grant is to improve student content learning and higher order reasoning, especially for students with disabilities. EU was developed during a two-year design-based implementation process with teachers and administrators co-designing the units with developers.

The evaluation employed a group randomized control trial in which classes were randomly assigned within teachers to receive the EU curriculum, or continue with business-as-usual. All teachers were trained in Enhanced Units. Overall, the study involved three districts, five schools, 13 teachers, 14 randomized blocks, and 30 classes (15 in each condition, with 18 in biology and 12 in U.S. History). This was an intent-to-treat design, with impact estimates generated by comparing average student outcomes for classes randomly assigned to the EU group with average student outcomes for classes assigned to control group status, regardless of the level of participation in or teacher implementation of EU instructional approaches after random assignment.

Overall, we found a positive impact of EU on student learning in history, but not on biology or across the two domains combined. Within biology, we found that students experienced greater impact on the Evolution unit than the Ecology unit. These findings supports a theory developed by the program developers that EU works especially well with content that progresses in a sequential and linear way. We also found a positive differential effect favoring students with disabilities, which is an encouraging result given the goal of the grant.

Final Report of CAST Enhanced Units Findings

The full report for this study can be downloaded using the link below.

Enhanced Units final report

Dissemination of Findings

2023 Dissemination

In April 2023, The U.S. Department of Education’s Office of Innovation and Early Learning Programs (IELP) within the Office of Elementary and Secondary Education (OESE) compiled cross-project summaries of completed Investing in Innovation (i3) and Education Innovation and Research (EIR) projects. Our CAST Enhanced Units study is included in one of the cross-project summaries. Read the 16-page summary using the link below.

Findings from Projects with a Focus on Serving Students with Disabilities

2020 Dissemination

Hannah D’ Apice presented these findings at the 2020 virtual conference for the Society for Research on Educational Effectiveness (SREE) in September 2020. Watch the recorded presentation using the link below.

Symposium Session 9A. Unpacking the Logic Model: A Discussion of Mediators and Antecedents of Educational Outcomes from the Investing in Innovation (i3) Program

2019-12-26

Come and See Us in 2020

For a 13th consecutive year, we will be presenting research topics of interest at the annual meeting of the American Educational Research Association (AERA). This year, the meeting will be held in our very own San Francisco. Some of our presentation topics include: Strategies for Teacher Retention, Impact Evaluation of a Science Teacher Professional Learning Intervention, and Combining Strategic Instruction Model Routines with Technology to Improve Academic Outcomes for Students with Disabilities. We’ll also be making our unprecedented appearance at AERA’s sister conference The National Council on Measurement in Education (NCME). Our topic will be about connecting issues of measurement to accuracy of impact estimates.

In addition to our numerous presentations at AERA and NCME, we will also be traveling to Washington DC in March to present at the annual conference of the Society for Research on Educational Effectiveness (SREE). We’re included in three presentations as part of a symposium on Social and Emotional Learning in Educational Settings & Academic Learning, and we have one presentation and a poster that report the results of a randomized trial conducted as part of an i3 validation grant, and address certain methodological challenges we have faced in conducting RCTs generally. In all, we will be disseminating results of, and discussing approaches to addressing technical challenges, from three i3 projects. We have either presented at or attended the SREE conference for the past 14 years, and look forward to the rich program that SREE is bound to put together for us in 2020.

We would be delighted to see you in either San Francisco or Washington DC. Please let us know if you plan to attend either conference.

2019-12-16

Findings from our Recent Research on Learning A-Z’s Raz-Plus

Learning A-Z contracted with Empirical Education to conduct a study on their personalized reading solution: Raz-Plus. In 2019, Raz-Plus was honored by SIIA with a CODiE Award in the category of Best Reading/Writing/Literature Instructional Solution for Grades PreK-8!

We are excited to release the results of our recent study of Raz-Plus in Milwaukee Public Schools. Raz-Plus is a literacy program that includes leveled books, skills practice, and digital activities and assessments.

The quasi-experimental study was conducted using data from the 2016-17 school year and examined the impact of Raz-Plus usage on student achievement for 3rd, 4th, and 5th grade students using the STAR Reading (STAR) assessment. Nearly 25,000 students across 120 schools in the district completed over 3 million Raz-Plus activities during the study year. There were three main findings from the study:

  1. STAR scores for students in classes of teachers who actively used Raz-Plus are better than for comparison students. The result had an effect size of .083 (p < .01), which corresponds to a 3-percentile point gain on the STAR test, adjusting for differences in student demographics and pretest between Raz-Plus and comparison students.
  2. The positive impact of Raz-Plus was replicated across many student subgroups, including Asian, African-American, and Hispanic students, as well as economically disadvantaged students and English Language Learners.
  3. Several Raz-Plus usage metrics were positively associated with STAR outcomes, most notably the number of quizzes assigned (p < .01). The average student would expect to see a 1 percentile point gain in their STAR score for every 21 quizzes assigned.

This study added to a growing body of evidence, both in Milwaukee Public Schools and other districts around the country, demonstrates the effectiveness of Learning A-Z’s independent leveled curriculum products for literacy. You can download the report using the link below.

Read the summary and find a link to download the report here.

2019-12-05

The Power of Logic Models

The Texas Education Agency (TEA) has developed initiatives aimed at reducing the number of low-performing public schools in Texas. As part of Regional Educational Laboratory (REL) Southwest’s School Improvement Research Partnership (SWSI) with TEA and Texas districts, researchers from REL Southwest planned a series of logic model training sessions that support TEA’s school improvement programs, such as the System of Great Schools (SGS) Network initiative.

To ensure that programs are successful and on track, program developers often use logic models to deepen their understanding of the relationships among program components (that is, resources, activities, outputs, and outcomes) and how these interact over time. A logic model is a graphical depiction of the logical relationship among the resources, activities, and intended outcomes of a program, with a series of if-then statements connecting the components. The value of using a logic model to undergird programs is that it helps individuals and groups implementing an initiative to articulate the common goals of the effort. Additionally, it helps to ensure that the strategies, resources, and supports provided to key stakeholders are aligned with the articulated goals and outcomes, providing a roadmap that creates clear connections across these program components. Finally, over the course of implementation, logic models can facilitate decisionmaking about how to adjust implementation and make changes to the program that can be tested to ensure they align with overall goals and outcomes identified in the logic model.

The logic model training is designed to provide TEA with a hands-on experience to develop logic models for the state’s school improvement strategy. Another overarching goal is to build TEA’s capacity to support local stakeholders with the development of logic models for their school improvement initiatives aligned with Texas’s strategy and local context.

The first training session, titled “School Improvement Research Partnership: Using Logic Modeling for Statewide School Improvement Efforts,” was held earlier this year. SWSI partners focused on developing a logic model for the SGS initiative. It was an in-person gathering aimed at teaching participants how to create logic models by addressing the following:

  • Increasing knowledge of general concepts, purposes, and uses of logic models
  • Increasing knowledge and understanding of the components that make up a logic model
  • Building capacity in understanding links between components of school improvement initiatives
  • Providing hands-on opportunities to develop logic models for local school improvement initiatives

The timing of the logic model workshop was helpful because it allowed the district-focused SGS leaders at TEA to organize the developed SGS framework into a logic model that enables TEA to plan and guide implementation, lay the foundation for the development of an implementation rubric, and serve as a resource to continuously improve the strategy. TEA also plans to use the logic model to communicate with districts and other stakeholders about the sequence of the program and intended outcomes.

REL Southwest will continue to provide TEA with training and technical support and will engage local stakeholders as the logic models are finalized. These sessions will focus on refining the logic models and ensure that TEA staff will be equipped with the ability to develop logic models on their own for current and future initiatives and programs.

This blog post was co-published with REL Southwest.

2019-08-07
Archive