A Moment of Zen
I visited Denis in La Jolla, in March 2024 . We talked about Denis’ career, and how his philosophy about education and research shaped the mission and vision of Empirical Education. After my visit I wrote the following blog, which I now share in remembrance of Denis. — Andrew
A Moment of Zen
There are specific moments in life that mark a threshold of major change and new direction.
One such occasion was a lunch date I had with Denis Newman almost exactly 20 years ago. He had just started Empirical Education on Sherman Avenue in Palo Alto. We met at Joanie’s Café on California Avenue.
It was one for those perfect days set in the Mediterranean climate, typical of California.
Such events distill to a few concrete memories: I am served a Caesar salad, the afternoon light is streaming in, I hand Denis a copy of Judith Singer’s article on applications of Hierarchical Linear Models (HLMs) in SAS. We begin our first discussion about Randomized Control Trials (RCTs) in educational research.
Denis had just submitted several grant proposals that would fund running RCTs in school districts to evaluate whether educational programs were having beneficial impacts on their students’ learning. Denis was riding a new wave in educational research, and wanted to know if I was interested in joining. It was exciting. My dissertation at Stanford was underway, and I needed a summer job.
It's now 20 years later. That first day is so palpable that I feel I can touch it. Yet, between then and now, there have been myriad paths taken and so much rich exploration. Empirical's office has moved from Sherman Ave. in Palo Alto to University Ave. in Berkeley. We’ve conducted 35 RCTs, and dozens of quasi-experiments across content areas and grade ranges. We've partnered directly with SEAs, LEAs, edtech companies, universities, and large research firms to identify and address critical questions from the field. We've adapted to changes in the education ecosystem, and developed tools and processes to make research more efficient and practical. Our team has expanded (and contracted) and we continue to work as a unit dedicated to improving outcomes for teachers and students.
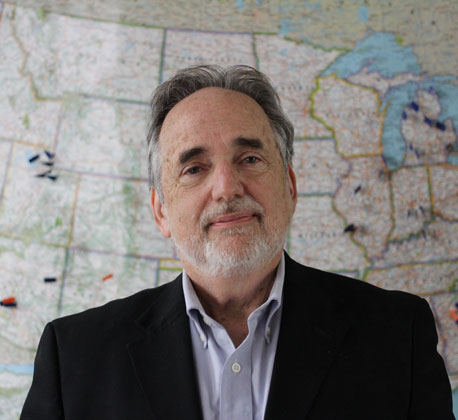
Denis is retired now and living in La Jolla, California. He actively serves on Empirical's board. I visited him last March. Some of what I write about here reflects my conversations with him, as well as some of my own memories.
A Happy Coincidence
My interest in and commitment to Empirical reflects that Denis and I have remained simpatico in some of our main beliefs.
When we met, I was reading a lot of Lee Cronbach's critiques of standard ideas about causal validity. Cronbach's ideas from the 1970's and 80's emphasized the role of context in program evaluation, and how effects of programs on educational outcomes vary depending on characteristics of students, teachers and schools. Context includes time, and time produces decade-by-treatment interactions, which means that program effects in the social sciences have short half-lives. My appreciation of the complexity of school systems also came from having taught third grade during the tumultuous integration of the class size reduction initiative in California. In my experience, context and unforeseen events undermined the best laid policy plans.
Denis had similar convictions. Ed tech products, in particular, demonstrated what Denis referred to as the short "shelf-life" of their effectiveness, with their rapid advancement leading to new program versions. Denis knew this very well from his earlier career (more on this below). At the same time, Denis was deeply intrigued by the quality of evidence that RCTs could yield. Randomizing students or classes or schools to receive the program, or to a control, yields statistically-equivalent groups. This means that any systematic difference between them in average outcomes has to be the result of one group receiving the program and the other not. That is, randomization permits a very dependable interpretation of the CAUSAL impact of the program relative to the control alternative.
The two ideas of (1) quickly evolving and context-dependent school systems, and (2) the potential of RCTs to measure causal impacts reliably, motivated a specific application of experiments that Denis recognized. The main question was: Could we achieve both context sensitivity, as well as the precision of randomization? (Call this the "relevance X precision challenge".)
Denis recognized that to respond to this challenge, RCTs had to be mobilized locally and rapidly to yield evidence that would be useful to individual school systems; that is, to support decisions concerning programs that were being considered by a district, or that had just been initiated. Context-responsive experiments of this sort contrasted with typically very large-scale and expensive experiments that took years to plan, conduct, analyze, and report, and oftentimes without a clear sense of a suitable inference population.
Denis and I arrived at some of these ideas from different places but with similar interests and passions. Three main ideas were these:
- Complexity as boon not bane
- The importance of statistical interactions in representing the complexity of conditions for effects
- The need to respect locally-defined interests and conditions
Years ago, I shared with Denis a couple of works by Cronbach: his 1975 article Beyond the Two Disciplines of Scientific Psychology, and his 1982 book Designing Evaluations of Educational and Social Programs. After reading them, Denis asked: "What is there left to be said?" During my visit to La Jolla I reminded him of this, and asked if he had anything to add to his insight. He said "no". I smiled at the peculiarity of my question, and the obviousness of his response (given his earlier reaction to Crobach’s work.) It was a moment of Zen.
I am astounded that since those early discussions with Denis about the "relevance X precision" challenge, I can say the field has addressed only some of that challenge, and answers often are in the form of further questions. They inspire inquiry that is engaging, meaningful, and focused on applications.
It is important to point out that since I joined Empirical, much of the methodology we both employed and helped to co-develop was in the process of being worked out. It was a nascent period in the gradual development of IES' standards of evidence. The field was learning and codifying methods. We played a role in that pioneering process. During our discussion in La Jolla, Denis emphasized the importance of HLM. It was a technological capability that moved the field solidly into multivariate analysis and achieved efficiency that previously had been elusive.
Democratization of Research
The priorities noted above—the need for both needs-responsive and contextually-relevant evaluation solutions, and the use of the most rigorous (RCT) solutions for causal inference—underscore another very important idea that is well-understood in the world of program evaluation. It is the need for the research efforts and questions to be motivated by persons for whom the results have the highest stakes: those who have to make decisions, and those who will (or will not) get the program!
With a view to this, Denis often spoke about the democratization of research. This meant that district people had to be right in the mix: informing the questions, understanding the design and language of reporting, and knowing what to do with the results. Here are four short examples where this priority came through.
- Denis and I often engaged in a tug-of-war of language in writing our reports. I would often write about "models", "impacts", and "random effects". Denis' response, paraphrased, was: "explain to a non-technical audience—the main consumer of the report—what you mean by these terms, and while you're at it, clarify what the p-value means, and forget about the completely arbitrary 5% significance level; instead, describe results in terms of degrees of confidence". Every instance of jargon would lead more of the main audience to tune out.
- Denis took issue with the use of the word "model". Methodologists take mathematical models for granted. The acronym HLM includes "Model". But Denis' concern was with the underlying ambiguity that would make the finding inaccessible. Over time, this has made me realize that notation and jargon function as instruments for efficient communication among experts, but they can be thought-arresting clichés for those less-familiar with the abstraction. They must be used sparingly and clearly.
- As noted above, Denis wanted the people on the ground to be in the thick of it. In his program of locally conducted RCTs, he would travel to the districts where the research was taking place, and lead sessions in which teachers would organize themselves into matched pairs for randomization. This approach took advantage of individual judgment and inside knowledge of stakeholders about the myriad factors affecting outcomes, instead of relying on algorithms to sort matched pairs in terms of existing and often weak administrative data. This participation also spiked participants’ interest in the research and evaluation and promoted their understanding of it.
- There was also a concern Denis shared about a result from one of our main research projects. The AMSTI project demonstrated positive average impacts of the program, but not for minorities. It seemed to me that Denis was concerned about the funder-required messaging. It prioritized the positive sample-wide average impact, but underplayed the finding of differential impact: a result which would have been of primary interest to large segments of the study sample and the evaluation participants and partners.
Related to these points was Denis' insistence on setting the methods against the presenting reality. For example, he stressed what is obvious, but too easily missed in application of HLM methods: the interdependence of students and their outcomes reflect a highly complex ecology that can be reflected only roughly through mathematical models—the models cannot keep up with reality. He observed that dependencies in outcomes that happen in real school systems, and that motivate the use of HLM, often are way more complex than we can capture through meager indicators in our models. Denis was concerned with important and real facts being overlooked when results were constrained to fit statistical models and criteria. (I think Denis' objection was also on a deeper philosophical level. For example, he pondered how introducing multiple comparisons adjustments to results of an experiment can suddenly alter the interpretation of an effect from it being real to it being unreal - as if the reality depended on rules of the game that we invented for interpreting results.) It seemed to me that Denis was pointing out that the metaphysics and epistemology behind it plays an implicit but very important role because it drives the underlying assumptions behind all our methods. I have come around to this point of view. Unfortunately, on more than a few occasions, I have been reminded by some methodologists who champion experiments that philosophy is mere speculation and anti-scientific gobbledygook.
I can't say I fully understand the layers in Denis' perspective on research, but questions about the motivating philosophy were always there. In La Jolla he noted: "It (Wittgenstein's view) seems to be fundamental to everything we're doing." This is something to reflect on. I have not dug deeply into Wittgenstein, or Denis' view of his ideas, but it gives me pause to imagine all that we do in quantitative experimental research—an enterprise with blueprints for methods, accepted rules, and shared language and assumptions—as a "language game" (in Wittgenstein's sense) conducted in a specific arena. How can we improve the game? What does it mean to change the rules? (This is content for another blog.)
The Past.
The purpose of this blog is not a place to discuss Denis' many endeavors, and I am not the best person to do that. However, when visiting Denis in La Jolla, he described a few memorable milestones. Many of them were prescient of the way research and evaluation in education would move in the decades to come. His experiences included early uses of small group collaborative activities via LAN (local area networks) with children. Denis singled out School PS125 in Manhattan in South Harlem, where he and his colleagues set up a shared server, and allowed students to take work they had done in the previous year into their new year. This allowed growth through accumulated experience, and provided a sense of continuity, purpose and ownership. He noted the product was different because, by including prior years' efforts, the work space was understood by the students as "theirs".
Denis also emphasized some of his early exploration of AI in reading applications. He pointed out the discovery that children can talk-through their reading experiences [via "speech captures"], transforming what it means to read aloud. Instead of being passive, reading becomes active, like talking to an adult who is listening to the talk, and responding intelligently. Denis asserted "we were doing AI!"
One article by Denis and his colleague, Michael Cole, is very interesting to me because it was written and published about the time that Denis started Empirical. It provides a critical link between literature on developmental psychology and experimental field research in education.
The work first discusses learning theory, focusing on the contrast between how problems are presented and solved in laboratory tasks with children, and how program implementation and learning occur in classrooms. Referring to Vygotsky, the authors note that "cognitive processes begin externally and especially in social interactions with adults and peers…before becoming abstract and internal…entail(ing) that implementing educational programs requires establishing systems of interactions (p. 264)." Such interactions invariably introduce variability in implementation and outcomes that are hard to control, and purposefully reducing this variability may compromise ecological validity.
The authors then break to a discussion of what at the time (2002) was a renewed imperative by the Department of Education for scientifically strong research with a focus on experiments. They emphasize the "difficulty of replicating experimental treatments on a large scale" (p. 263). My reading of this, with risk of oversimplification, is that Denis' work in developmental psychology alerted him to the divide between how learning happens in the lab and what occurs in the classroom. The latter identifies the more-experienced adult (teacher) as central to students' internalization of concepts. The interaction between pupils and their teacher—the basic building block of development and learning in the relevant ecology—introduces variance in implementation. This variability presents a fundamental challenge to the use of field experiments in education. Experimental control and adherence to scripted implementation can shut down potential for local program improvements: "the experimental research may be trading off higher levels of overall effectiveness simply for lowering variability" (p. 265). All of these issues are still completely relevant and far from solved: one can imagine a multi-armed RCT with different levels of controlled implementation to see if there are diminishing returns to scripting that implementation, and whether there is a negative correlation between level of control in implementation and program impact.
The Future.
The points summarized above are fodder for the future.
I'm happy to say that Empirical continues in much the same spirit: figuring context into research, while attending to the context of research.
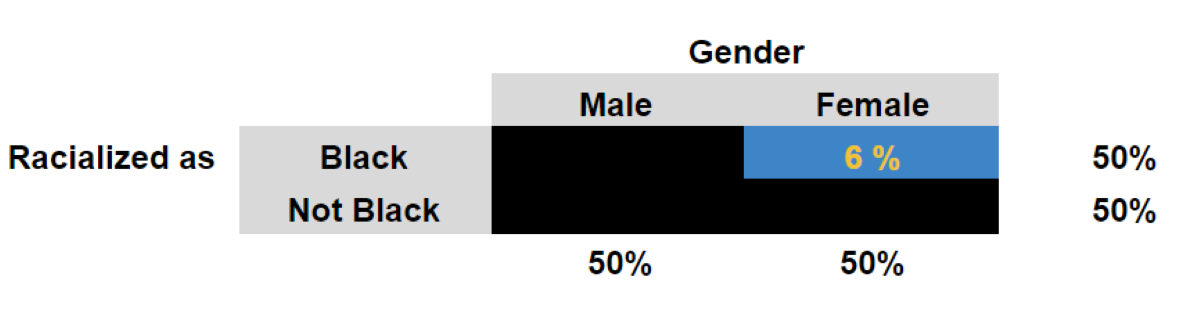
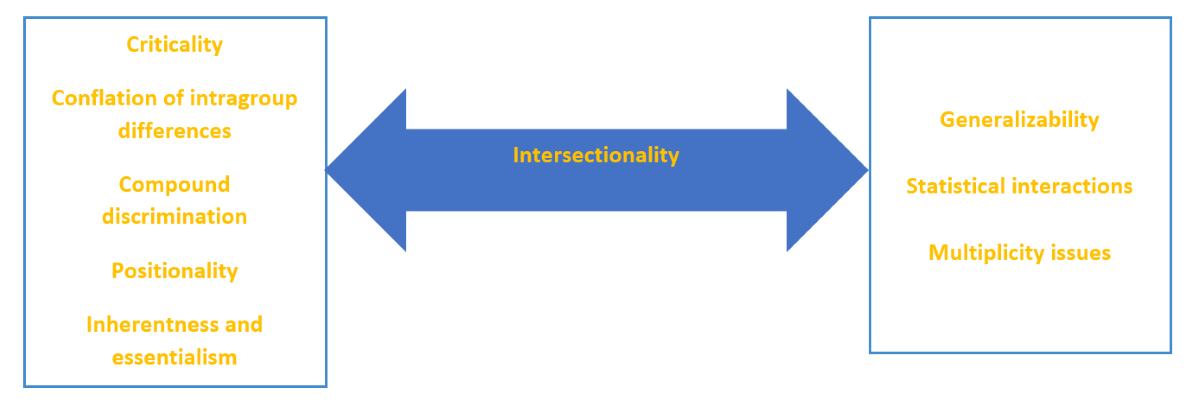
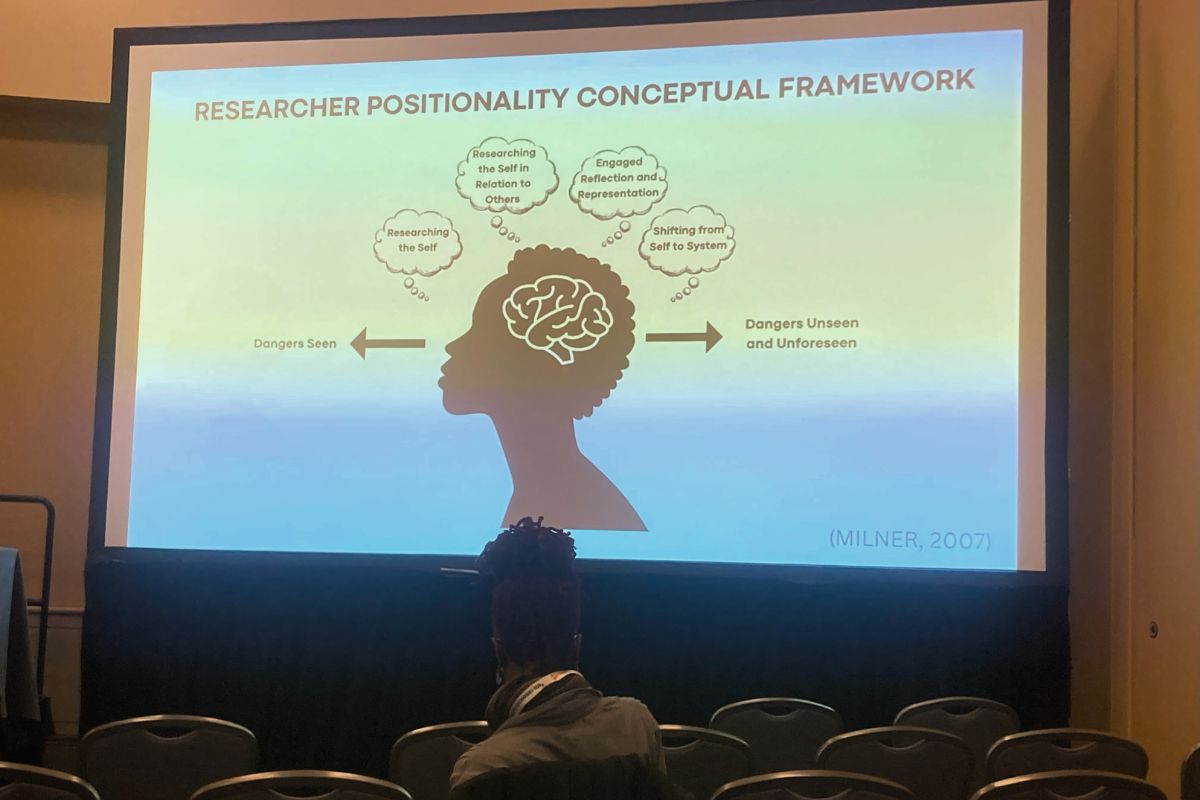
For example, later this month at SREE, I am presenting on the concept of intersectionality in educational research, and its possible implications for quantitative analysis. The idea originates in legal work addressing a "conflation in intragroup differences" (Crenshaw, 1991, p. 1242) that undermines the complexity of group identities, and their relationship to valued outcomes, and that leads to discriminatory practices. Digging into the issue reveals the need to understand and state our positionality, including philosophical commitments and methodological assumptions, in order to address the issues comprehensively and authentically, and avoid a drift towards use of quantitative platitudes.
As another example of upholding this spirit in research, I used the occasion of my article Hold The Bets! Should Quasi-Experiments Be Preferred to True Experiments When Causal Generalization Is the Goal? to provide groundwork for thinking about what it means, operationally, to evaluate the internal and external validity of causal inferences as part of the same problem. Also, concerns Denis expressed about the validity of using results from “one big study” conducted in the past to inform policy for individual locales, including for individual schools and districts, (with parallel questions by Lee Cronbach), provided an impetus to my dissertation efforts. It is reflected in my work about evaluating the accuracy of generalizations of broad causal inferences applied to local contexts—so called "large to small generalizations".
Empirical's mission is established by Denis' interest in serving individuals who are most directly impacted by the results of the research, his commitment to democratizing research, and his imperative to take measure of the methods against the reality they purport to represent. This path is lasting. Denis' early work on applications of computer networks in classroom and AI, and on the ecological validity of causal inferences, are more relevant than ever, and the issues they raise confront us forcefully today as we strive to find solutions in an ever-more challenging world.
The journey continues. Here's to the next 20 years!


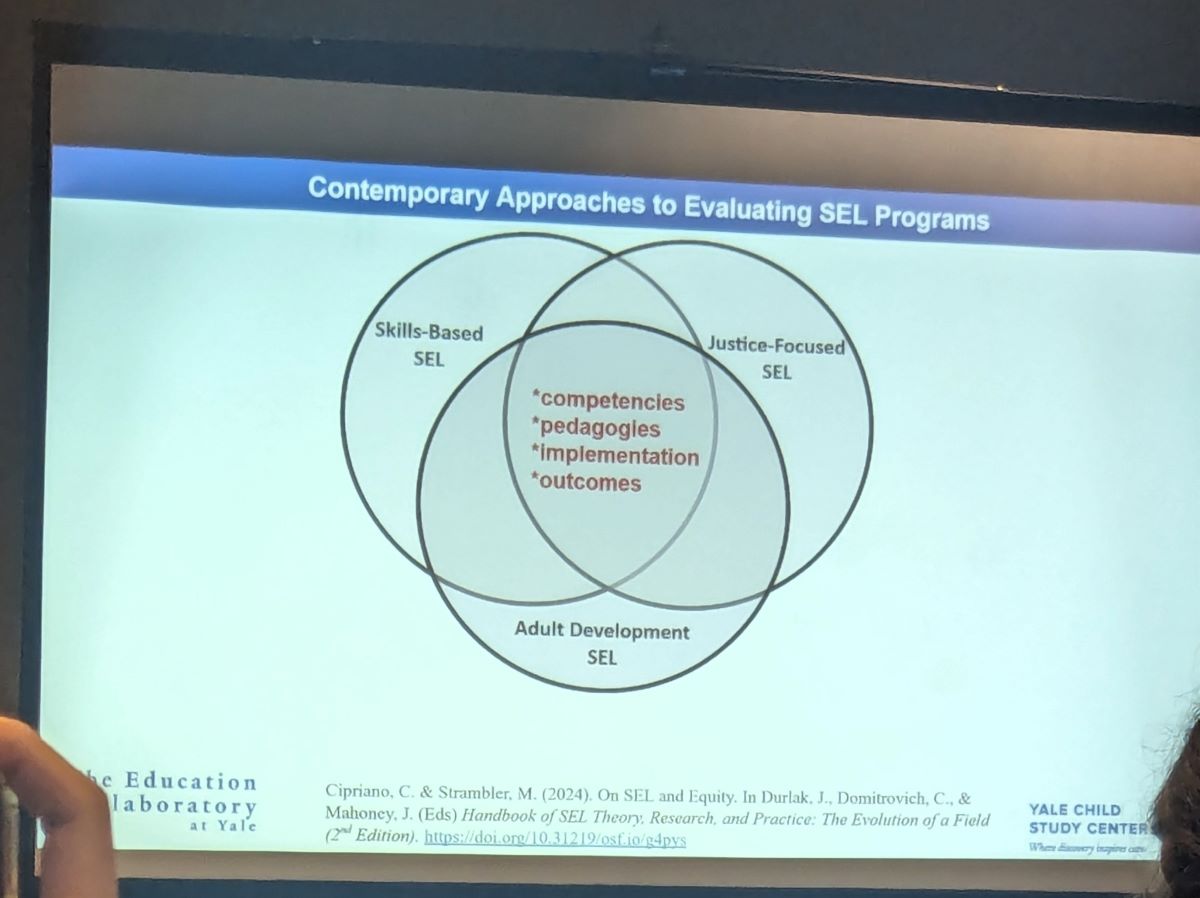 I was excited to attend a session focused on Social Emotional Learning (SEL), a topic that directly relates to the projects I am currently involved in. The symposium featured four papers that all highlighted the importance of conducting high-quality evaluations of Universal School-Based (USB) SEL initiatives.