blog posts and news stories

State Reports Show Almost All Teachers Are Effective or Highly So. Is This Good News?

The New York Times recently picked up a story, originally reported in Education Week two months ago, that school systems using formal methods for classroom observation as part of their educator evaluations are giving all but a very small percent of teachers high ratings—a phenomenon commonly known as the “widget effect.” The Times quotes Russ Whitehurst as suggesting that “It would be an unusual profession that at least 5 percent are not deemed ineffective.”

Responding to the story in her blog, Diane Ravitch calls it “unintentionally hilarious,” portraying the so-called reformers as upset that their own expensive evaluation methods are finding that most teachers are good at what they do. In closing, she asks, “Where did all those ineffective teachers go?”

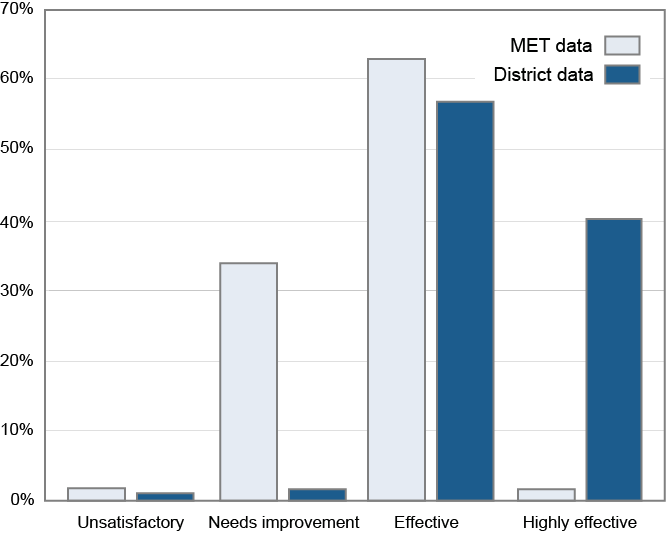
We’re a research company working actively on teacher evaluation, so we’re interested in these kinds of questions. Should state-of-the-art observation protocols have found more teachers in the “needs improvement” category or at least 5% labeled “ineffective”? We present here an informal analysis meant to get an approximate answer, but based on data that was collected in a very rigorous manner. As one of the partners in the Gates Foundation’s Measures of Effective Teaching (MET) project, Empirical Education has access to a large dataset available for this examination, including videotaped lessons for almost 2,000 teachers coded according to a number of popular observational frameworks. Since the MET raters were trained intensively using methods approved by the protocol developers and had no acquaintance or supervisory relationship with the teachers in the videos, there is reason to think that the results show the kind of distribution intended by the developers of the observation methods. We can then compare the results in this controlled environment to the results referred to in the EdWeek and Times articles, which were based on reporting by state agencies. We used a simple (but reasonable) way of calculating the distribution of teachers in the MET data according to the categories in one popular protocol and compared it to the results reported by one of the states for a district known to have trained principals and other observers in the same protocol. We show the results here. The light bars show the distribution of the ratings in the MET data. We can see that a small percentage are rated “highly effective” and an equally small percentage “unsatisfactory.” So although the number doesn’t come up to the percent suggested by Russ Whitehurst, this well-developed method finds only 2% of a large sample of teachers to be in the bottom category. About 63% are considered “effective”, while a third are given a “needs improvement” rating. The dark bars are the ratings given by the school district using the same protocol. This shows a distribution typical of what EdWeek and the Times reported, where 97% are rated as “highly effective” or “effective.” It is interesting that the school district and MET research both found a very small percentage of unsatisfactory teachers.

Where we find a big difference is in the fact that the research program deemed only a small number of teachers to be exceptional while the school system used that category much more liberally. The other major difference is in the “needs improvement” category. When the observational protocol is used as designed, a solid number of teachers are viewed as doing OK but potentially doing much better. Both in research and in practice, the observational protocol divides most teachers between two categories. In the research setting, the distinction is between teachers who are effective and those who need improvement. In practice, users of the same protocol distinguish between effective and highly effective teachers. Both identify a small percent as unsatisfactory.

Our analysis suggests two problems with the use of the protocol in practice: first, the process does not provide feedback to teachers who are developing their skills, and, second, it does not distinguish between very good teachers and truly exceptional ones. We can imagine all sorts of practical pressures that, for the evaluators (principals, coaches and other administrators) decrease the value of identifying teachers who are less than fully effective and can benefit from developing specific skills. For example, unless all the evaluators in a district simultaneously agree to implement more stringent evaluations, then teachers in the schools where such evaluations are implemented will be disadvantaged. It will help to also have consistent training and calibration for the evaluators as well as accountability, which can be done with a fairly straightforward examination of the distribution of ratings.

Although this was a very informal analysis with a number of areas where we approximated results, we think we can conclude that Russ Whitehurst probably overstated the estimate of ineffective teachers but Diane Ravitch probably understated the estimate of teachers who could use some help and guidance in getting better at what they do.

Postscript. Because we are researchers and not committed to the validity of the observational methods, we need to state that we don’t know the extent to which the teachers labeled ineffective are generally less capable of raising student achievement. But researchers are notorious for ending all our reports with “more research is needed!”

2013-04-20

Can We Measure the Measures of Teaching Effectiveness?

Teacher evaluation has become the hot topic in education. State and local agencies are quickly implementing new programs spurred by federal initiatives and evidence that teacher effectiveness is a major contributor to student growth. The Chicago teachers’ strike brought out the deep divisions over the issue of evaluations. There, the focus was on the use of student achievement gains, or value-added. But the other side of evaluation—systematic classroom observations by administrators—is also raising interest. Teaching is a very complex skill, and the development of frameworks for describing and measuring its interlocking elements is an area of active and pressing research. The movement toward using observations as part of teacher evaluation is not without controversy. A recent OpEd in Education Week by Mike Schmoker criticizes the rapid implementation of what he considers overly complex evaluation templates “without any solid evidence that it promotes better teaching.”

There are researchers engaged in the careful study of evaluation systems, including the combination of value-added and observations. The Bill and Melinda Gates Foundation has funded a large team of researchers through its Measures of Effective Teaching (MET) project, which has already produced an array of reports for both academic and practitioner audiences (with more to come). But research can be ponderous, especially when the question is whether such systems can impact teacher effectiveness. A year ago, the Institute of Education Sciences (IES) awarded an $18 million contract to AIR to conduct a randomized experiment to measure the impact of a teacher and leader evaluation system on student achievement, classroom practices, and teacher and principal mobility. The experiment is scheduled to start this school year and results will likely start appearing by 2015. However, at the current rate of implementation by education agencies, most programs will be in full swing by then.

Empirical Education is currently involved in teacher evaluation through Observation Engine: our web-based tool that helps administrators make more reliable observations. See our story about our work with Tulsa Public Schools. This tool, along with our R&D on protocol validation, was initiated as part of the MET project. In our view, the complexity and time-consuming aspects of many of the observation systems that Schmoker criticizes arise from their intended use as supports for professional development. The initial motivation for developing observation frameworks was to provide better feedback and professional development for teachers. Their complexity is driven by the goal of providing detailed, specific feedback. Such systems can become cumbersome when applied to the goal of providing a single score for every teacher representing teaching quality that can be used administratively, for example, for personnel decisions. We suspect that a more streamlined and less labor-intensive evaluation approach could be used to identify the teachers in need of coaching and professional development. That subset of teachers would then receive the more resource-intensive evaluation and training services such as complex, detailed scales, interviews, and coaching sessions.

The other question Schmoker raises is: do these evaluation systems promote better teaching? While waiting for the IES study to be reported, some things can be done. First, look at correlations of the components of the observation rubrics with other measures of teaching such as value-added to student achievement (VAM) scores or student surveys. The idea is to see whether the behaviors valued and promoted by the rubrics are associated with improved achievement. The videos and data collected by the MET project are the basis for tools to do this (see earlier story on our Validation Engine.) But school systems can conduct the same analysis using their own student and teacher data. Second, use quasi-experimental methods to look at the changes in achievement related to the system’s local implementation of evaluation systems. In both cases, many school systems are already collecting very detailed data that can be used to test the validity and effectiveness of their locally adopted approaches.

2012-10-31

2010-2011: The Year of the VAM

If you haven’t heard about Value-Added Modeling (VAM) in relation to the controversial teacher ratings in Los Angeles and subsequent brouhaha in the world of education, chances are that you’ll hear about it in the coming year.

VAM is a family of statistical techniques for estimating the contribution of a teacher or of a school to the academic growth of students. Recently, the LA Times obtained the longitudinal test score records for all the elementary school teachers and students in LA Unified and had a RAND economist (working as an independent consultant) run the calculations. The result was a “score” for all LAUSD elementary school teachers. Note that the economist who did the calculations wrote up a technical report on how it was done and the specific questions his research was aimed at answering.

Reactions to the idea that a teacher could be evaluated using a set of test scores—in this case from the California Standards Test—were swift and divisive. The concept was denounced by the teachers’ union, with the local leader calling for a boycott. Meanwhile, the US Secretary of Education, Arne Duncan, made headlines by commenting favorably on the idea. The LA Times quotes him as saying “What’s there to hide? In education, we’ve been scared to talk about success.”

There is a tangle of issues here, along with exaggerations, misunderstandings, and confusion between research techniques and policy decisions. This column will address some of the issues over the coming year. We also plan to announce some of our own contributions to the VAM field in the form of project news.

The major hot-button issues include appropriate usage (e.g., for part or all of the input to merit pay decisions) and technical failings (e.g., biases in the calculations). Of course, these two issues are often linked; for example, many argue that biases may make VAM unfair for individual merit pay. The recent Brief from the Economic Policy Institute, authored by an impressive team of researchers (several our friends/mentors from neighboring Stanford), makes a well reasoned case for not using VAM as the only input to high-stakes decisions. While their arguments are persuasive with respect to VAM as the lone criterion for awarding merit pay or firing individual teachers, we still see a broad range of uses for the technique, along with the considerable challenges.

For today, let’s look at one issue that we find particularly interesting: How to handle teacher collaboration in a VAM framework. In a recent Education Week commentary, Kim Marshall argues that any use of test scores for merit pay is a losing proposition. One of the many reasons he cites is its potentially negative impact on collaboration.

A problem with an exercise like that conducted by the LA Times is that there are organizational arrangements that do not come into the calculations. For example, we find that team teaching within a grade at a school is very common. A teacher with an aptitude for teaching math may take another teacher’s students for a math period, while sending her own kids to the other teacher for reading. These informal arrangements are not part of the official school district roster. They can be recorded (with some effort) during the current year but are lost for prior years. Mentoring is a similar situation, wherein the value provided to the kids is distributed among members of their team of teachers. We don’t know how much difference collaborative or mentoring arrangements make to individual VAM scores, but one fear in using VAM in setting teacher salaries is that it will militate against productive collaborations and reduce overall achievement.

Some argue that, because VAM calculations do not properly measure or include important elements, VAM should be disqualified from playing any role in evaluation. We would argue that, although they are imperfect, VAM calculations can still be used as a component of an evaluation process. Moreover, continued improvements can be made in testing, in professional development, and in the VAM calculations themselves. In the case of collaboration, what is needed are ways that a principal can record and evaluate the collaborations and mentoring so that the information can be worked into the overall evaluation and even into the VAM calculation. In such an instance, it would be the principal at the school, not an administrator at the district central office, who can make the most productive use of the VAM calculations. With knowledge of the local conditions and potential for bias, the building leader may be in the best position to make personnel decisions.

VAM can also be an important research tool—using consistently high and/or low scores as a guide for observing classroom practices that are likely to be worth promoting through professional development or program implementations. We’ve seen VAM used this way, for example, by the research team at Wake County Public Schools in North Carolina in identifying strong and weak practices in several content areas. This is clearly a rich area for continued research.

The LA Times has helped to catapult the issue of VAM onto the national radar. It has also sparked a discussion of how school data can be used to support local decisions, which can’t be a bad thing.

2010-09-18
Archive