blog posts and news stories

New Research Project Evaluating the Impact of FRACTAL

Empirical Education will partner with WestEd, Katabasis, and several school districts across North Carolina to evaluate their early-phase EIR development project, Furthering Rural Adoption of Computers and Technology through Artistic Lessons (FRACTAL). This five year grant will support the development and implementation of curriculum materials and professional development aimed at increasing computer self-efficacy and interest in STEAM careers among underserved rural middle school students in NC.

Participating students will build and keep their own computers and engage with topics like AI art. WestEd and Katabasis will work with teachers to co-design and pilot multiple expeditions that engage students in CS through their art and technology classes, culminating in an impact study in the final year (the 2026-27 school year).

Stay tuned for updates on results from the implementation study, as well as progress with the impact study.

Circuit board photo by Malachi Brooks on Unsplash

2023-11-06

Revisiting The Relationship Between Internal and External Validity

The relationship between internal and external validity has been debated over the last few decades.

At the core of the debate is the question of whether causal validity comes before generalizability. To oversimplify this a bit, it is a question of whether knowing “what works” is logically prior to the question of what works “for whom and under what conditions.”

Some may consider the issue settled. I don’t count myself among them.

I think it is extremely important to revisit this question in the contemporary context, in which discussions are centering on issues of diversity of people and places, and the situatedness of programs and their effects.

In this blog I provide a new perspective on the issue, one that I hope rekindles the debate, and leads to productive new directions for research. (It builds on presentations at APPAM and SREE.)

I have organized the content into three degrees of depth. 1. For those interested in a perusal, I have addressed the main issues through a friendly dialogue presented below. 2. For those who want a deeper dive, I provide a video of a PowerPoint in which I take you through the steps of the argument. 3. The associated paper, Hold the Bets! Do Quasi-and True Experimental Evaluations Yield Equally Valid Impact Results When Effect Generalization is the Goal?, is currently posted as a preprint on SAGE Advance, and is under review by a journal.

Lastly, I would really value your comments to any of these works, to keep the conversation, and the progress in and beneficence from research going. Enjoy (and I hope to hear from you!),

Andrew Jaciw

The Great Place In-Between for Researchers and Evaluators

The impact evaluator is at an interesting crossroads between research and evaluation. There is an accompanying tension, but one that provides fodder for new ideas.

The perception of doing research, especially generalizable scientific research, is that it contributes information about the order of things, and about the relations among parts of systems in nature and society, that leads to cumulative and lasting knowledge.

Program evaluation is not quite the same. It addresses immediate needs, seldom has the luxury of time, and is meant to provide direction for critical stakeholders. It is governed by Program Evaluation Standards, of which Accuracy (including internal and statistical conclusions validity) is just one of many standards, with equal concern for Propriety and Stakeholder Representation.

The activities of the researcher and the evaluator may be seen as complementary, and the results of each can serve evaluative and scientific purposes.

The “impact evaluator” finds herself in a good place where the interests of the researcher-evaluator and evaluator-researcher overlap. This zone is a place where productive paradoxes emerge.

Here is an example from this zone. It takes the form of a friendly dialogue between an Evaluator-Researcher (ER) and a Researcher-Evaluator (RE).

ER: Being quizzical about the problem of external validity, I have proposed a novel method for answering the question of “what works”, or, more correctly of “what may work” in my context. It assumes a program has not yet been tried at my site of interest (the inference sample), and it involves comparing the performance across one or more sites where the program has been used, to performance at my site. The goal is to infer the impact for my site.

RE: Hold-on. So that’s kind of like a comparison group design but in reverse. You’re starting with an untreated group and comparing it to a treated group to draw an inference about potential impact for the untreated group. Right?

ER: Yes.

RE: But that does not make sense. That’s not the usual starting point. In research we start with the treated group and look for a valid control, not the other way around. I am confused.

ER: I understand, but when I was teaching, such comparisons were natural. For example, we compared the performance of a school just like ours, but that used Success For All (SFA), to performance at our school, which did not use SFA, to infer how we might have performed had we used the program. That is, to generalize the potential effect of the program for our site.

RE: You mean to predict impact for your site.

ER: Call it what you will. I prefer generalize because I am using information about performance under assignment to treatment from somewhere else.

RE: Hmmm. Odd, but OK (for now). However, why would you do that? Why not use an experimental result from somewhere else, maybe with some adjustment for differences in student composition and other things? You know, using reweighting methods, to produce a reasonable inference about potential impact for your site.

ER: I could, but that information would be coming from somewhere else where there are a lot of unknown variables about how that site operates, and I am not sure the local decision-makers would buy it. Coming from elsewhere it would be considered less-relevant.

RE: But your comparison also uses information from somewhere else. You’re using performance outcomes from somewhere else (where the treatment was implemented) to infer how your local site would have performed had the treatment been used there.

ER: Yes, but I am also preserving the true outcome in the absence of treatment (the ‘business as usual’ control outcome) for my site. I have half the true solution for my site. You’re asking me to get all my information from somewhere else.

RE: Yes, but I know the experimental result is unbiased from selection into conditions at the other “comparison” site, because of the randomized and uncompromised design. I‘ll take that over your “flipped” comparison group design any day!

ER: But your result may be biased from selection into sites, reflecting imbalance on known and possibly unknown moderators of impact. You’re talking about an experiment over there, and I have half the true solution over here, where I need it.

RE: I’ll take internal validity over there, first, and then worry about external validity to your site. Remember, internal validity is the “sine qua non”. Without it, you don’t have anything. Your approach seems deficient on two counts: first from lack of internal validity (you’re not using an experiment), and second from a lack of external validity (you’re drawing a comparison with somewhere else).

ER: OK, now you’re getting to the meat of things. Here is my bold conjecture: yes, internal and external validity bias both may be at play, but sometimes they may cancel each other out.

RE: What!? Like a chancy fluky kind of thing?

ER: No, systematically, and in principle.

RE: I don’t believe it. Two wrongs (biases) don’t make a right.

ER: But the product of two negatives makes a positive.

RE: I need something concrete to show what you mean.

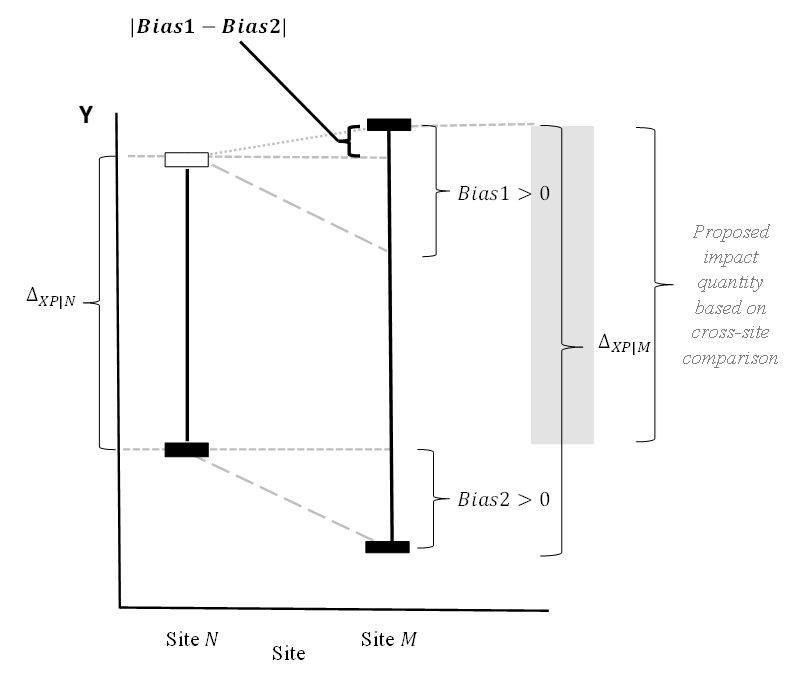
ER: OK, here is an instance… The left vertical bar is the average impact for my site (site N). The right vertical bar is the average impact for the remote site (site M). The short horizontal bars show the values of Y (the outcome) for each site. (The black ones show values we can observe, the white-filled one shows an unobserved value [i.e., I don’t observe performance at my site (N) when treatment is provided, so the bar is empty.]) Bias1 is the difference between the other site and my site in the average impact (the difference in length of the vertical bars). Bias2 results from a comparison between sites in their average performance in the absence of treatment.

A figure showing the difference between performance in the presence of treatment at one location, and performance in the absence of treatment at the other location, which is the inference site.

The point that matters here is that using the impact from the other site M (the length of the vertical line at M) to infer impact for my site N, leads to a result that is biased by an amount equal to the difference between the length of the vertical bars (Bias 1). But if I use the main approach that I am talking about, and compare performance under treatment at the remote site “M” (black bar at the top of Site M site) to the performance at my site without treatment (black bar at the bottom of Site N) the total bias is (Bias1 – Bias2), and the magnitude of this “net bias” is less than Bias1 by itself.

RE: Well, you have not figured-in the sampling error.

ER: Correct. We can do that, but for now let’s consider that we’re working with true values.

RE: OK, let’s say for the moment I accept what you’re saying. What does it do to the order and logic that internal validity precedes external validity?

ER: That is the question. What does it do? It seems that when generalizability is a concern, internal and external validity should be considered concurrently. Internal validity is the sole concern only when external validity is not at issue. You might say internal validity wins the race, but only when it’s the only runner.

RE: You’re going down a philosophical wormhole. That can be dangerous.

ER: Alright, then let’s stop here (for now).

RE and ER walk happily down the conference hall to the bar where RE has a double Jack, neat, and ER tries the house red.

BTW, here is the full argument and mathematical demonstration of the idea. Please share on social and tag us (our social handles are in the footer below). We’d love to know your thoughts. A.J.

2023-09-20

Multi-Arm Parallel Group Design Explained

What do unconventional arm wrestling and randomized trials have in common?

Each can have many arms.

What is a 3 arm RCT?

Multi arm trials (or multi arm RCTs) are randomized experiments in which individuals are randomly assigned to multiple arms: usually two or more treatment variants, and a control (a 3-arm RCT).

They can be referred to in a number of ways.

  • multi-arm trials
  • multi-armed trials
  • multiarm trials
  • multiarmed trials
  • multi arm RCTs
  • 3-arm, 4-arm, 5-arm, etc RCTs
  • multi-factorial design (a type of multi-arm trial)

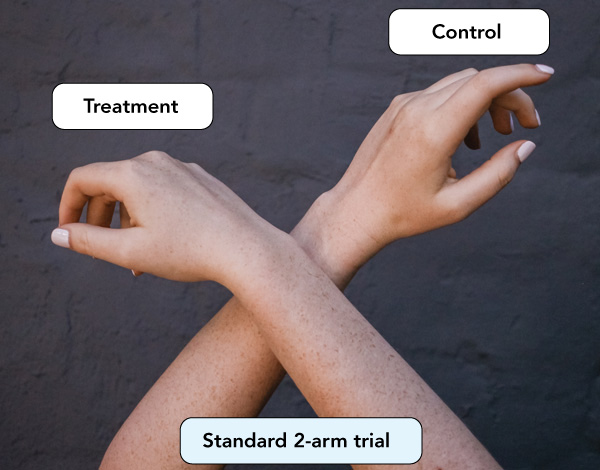
a figure illustrating a 2-arm trial with 2 arms with one labeled treatment and one labeled control

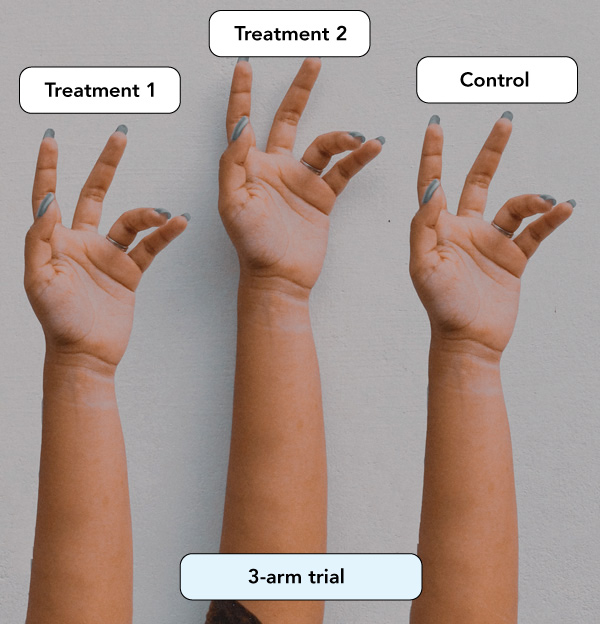
a figure illustrating a 3-arm trial with 3 arms with one labeled treatment 1, one labeled treatment 2, and one labeled control

When I think of a multiarmed wrestling match, I imagine a mess. Can’t you say the same about multiarmed trials?

Quite the contrary. They can become messy, but not if they’re done with forethought and consultation with stakeholders.

I had the great opportunity to be the guest editor of a special issue of Evaluation Review on the topic of Multiarmed Trials, where experts shared their knowledge.

Special Issue: Multi-armed Randomized Control Trials in Evaluation and Policy Analysis

We were fortunate to receive five valuable contributions. I hope the issue will serve as a go-to reference for evaluators who want to explore options beyond the standard two-armed (treatment-control) arrangement.

The first three articles are by pioneers of the method.

  • Larry L. Orr and Daniel Gubits: Some Lessons From 50 Years of Multi-armed Public Policy Experiments
  • Joseph Newhouse: The Design of the RAND Health Insurance Experiment: A Retrospective
  • Judith M. Gueron and Gayle Hamilton: Using Multi-Armed Designs to Test Operating Welfare-to-Work Programs

They cover a wealth of ideas essential for the successful conduct of multi-armed trials.

  • Motivations for study design and the choice of treatment variants, and their relationship to real-world policy interests
  • The importance of reflecting the complex ecology and political reality of the study context to get stake-holder buy-in and participation
  • The importance of patience and deliberation in selecting sites and samples
  • The allocation of participants to treatment arms with a view to statistical power

Should I read this special issue before starting my own multi-armed trial?

Absolutely! It’s easy to go wrong with this design, but if done right, it can yield more information than you’d get with a 2-armed trial. Sample allotment matters depending on the question you want to ask. In a 3-armed trial you have to ask yourself a question: Do you want 33.3% of the sample in each of the three conditions (two treatment conditions and control) or 25% in each of the treatment arms and 50% in control? It depends on the contrast and research question. So it requires you to think more deeply about what question it is you want to answer.

This sounds risky. Why would I ever want to run a multi-armed trial?

In short, running a multi-armed trial allows a head-to-head test of alternatives, to determine which provides a larger or more immediate return on investment. It also sets up nicely the question of whether certain alternatives work better with certain beneficiaries.

The next two articles make this clear. One study randomized treatment sites to one of several enhancements to assess the added value of each. The other used a nifty multifactorial design to simultaneously tests several dimensions of a treatment.

  • Laura Peck, Hilary Bruck, and Nicole Constance: Insights From the Health Profession Opportunity Grant Program’s Three-Armed, Multi-Site Experiment for Policy Learning and Evaluation Practice
  • Randall Juras, Amy Gorman, and Jacob Alex Klerman: Using Behavioral Insights to Market a Workplace Safety Program: Evidence From a Multi-Armed Experiment

More About 3 Arm RCTs

The special issue of Evaluation Review helped motivate the design of a multiarmed trial conducted through the Regional Educational Laboratory (REL) Southwest in partnership with the Arkansas Department of Education (ADE). We co-authored this study through our role on REL Southwest.

In this study with ADE, we randomly assigned 700 Arkansas public elementary schools to one of eight conditions determining how communication was sent to their households about the Reading Initiative for Student Excellence (R.I.S.E.) state literacy website.

The treatments varied on these dimensions.

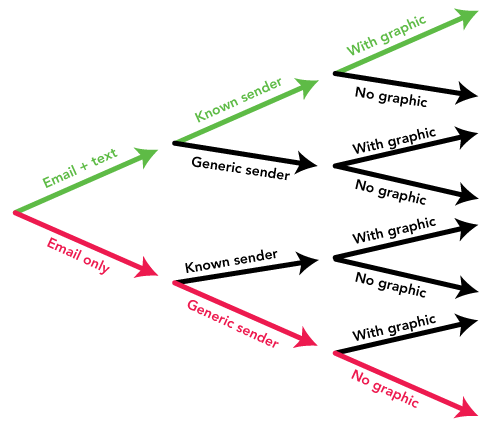
  1. Mode of communication (email only or email and text message)
  2. The presentation of information (no graphic or with a graphic)
  3. Type of sender (generic sender or known sender)

In January 2022, households with children in these schools were sent three rounds of communications with information about literacy and a link to the R.I.S.E. website. The study examined the impact of these communications on whether parents and guardians clicked the link to visit the website (click rate). We also conducted an exploratory analysis of differences in how long they spent on the website (time on page).

How do you tell the effects apart?

It all falls out nicely if you imagine the conditions as branches, or cells in a cube (both are pictured below).

In the branching representation, there are eight possible pathways from left to right representing the eight conditions.

In the cube representation, the eight conditions correspond to the eight distinct cells.

In the study, we evaluated the impact of each dimension across levels of the other dimensions: for example, whether click rate increases if email is accompanied with text, compared to just email, irrespective of who the sender is or whether the infographic is used.

We also tested the impact on click rates of the “deluxe” version (email + text, with known sender and graphic, which is the green arrow path in the branch diagram [or the red dot cell in the cube diagram]) versus the “plain” version (email only, generic sender, and no graphic, which is the red arrow path in the branch diagram [or green red dot cell in the cube diagram])

a figure illustrating the multi arms of the RCT and what intervention each of them received

a figure of a cube illustrating multi-armed trials

That’s all nice and dandy, but have you ever heard of the KISS principle: Keep it Simple Sweetie? You are taking some risks in design, but getting some more information. Is the tradeoff worth it? I’d rather run a series of two-armed trials. I am giving you a last chance to convince me.

Two armed trials will always be the staple approach. But consider the following.

  • Knowing what works among educational interventions is a starting point, but it does not go far enough.
  • The last 5-10 years have witnessed prioritization of questions and methods for addressing the questions of what work for whom and under which conditions.
  • However, even this may not go far enough to get to the question at heart of what people on the ground want to know. We agree with Tony Bryk that practitioners typically want to answer the following question.

What will it take to make it (the program) work for me, for my students, and in my circumstances?

There are plenty of qualitative, quantitative, and mixed methods to address this question. There also are many evaluation frameworks to support systematic inquiry to inform various stakeholders.

We think multi-armed trials help to tease out the complexity in the interactions among treatments and conditions and so help address the more refined question Bryk asks above.

Consider our example above. One question we explored was about how response rates varied across rural schools when compared to urban schools. One might speculate the following.

  • Rural schools are smaller, allowing principals to get to know parents more personally
  • Rural and non-rural households may have different kinds of usage and connectivity with email versus text and with MMS versus SMS

If these moderating effects matter, then the study, as conducted, may help with customizing communications, or providing a rationale for improving connectivity, and altogether optimizing the costs of communication.

Multi-armed trials, done well, increase the yield of actionable information to support both researcher and on-the-ground stakeholder interests!

Well, thank you for your time. I feel well-armed with information. I’ll keep thinking about this and wrestle with the pros and cons.

2023-05-31

New Research Project Evaluating the Impact of EVERFI’s WORD Force Program on Early Literacy Skills

Empirical Education and EVERFI from Blackbaud are excited to announce a new partnership. Researchers at Empirical will evaluate the impact and implementation of the WORD Force program, a literacy adventure for K-2 students.

The WORD Force program is designed to be engaging and interactive, using games and real-world scenarios to to teach students key reading and literacy skills and understand how to use them in context. It also provides students with personalized feedback and support, allowing them to work at their own pace and track their progress.

We will conduct the experiment within up to four school districts—working with elementary school teachers. This is our second project with EVERFI, and it builds on our 20 years of extensive experience conducting large-scale, rigorous randomized controlled trial (RCT) studies. (Read EVERFI’s press release about our first project with them.)

In our current work together, we plan to answer these five research questions. 1. What is the impact of WORD Force on early literacy achievement, including on spoken language, phonological awareness, phonics, word building, vocabulary, reading fluency, and reading comprehension, for students in grades K–2? 2. What is the impact of WORD Force on improving early literacy achievement for students in grades K-2 from low- to middle-income households, English Language Learner (ELL) students, by grade, and depending on teacher background (e.g., years of teaching experience, or responses to baseline survey about orientation to literacy instruction)? 3. What is the impact of WORD Force on improving early literacy achievement for students in grades K-2 who struggle with reading (i.e., those in greatest need of reading intervention) as determined through a baseline assessment of literacy skills? 4. What are realized levels of implementation/usage by teachers and students, and are they associated with achievement outcomes? 5. Do impacts on intermediate instructional/implementation outcomes mediate impacts on achievement ?

Using a matched-pairs design, we will pair teachers who are similar in terms of years of experience and other characteristics. Then, from each pair, we will randomize one teacher to the WORD Force group and the other to the business-as-usual (BAU) control group. This RCT design will allow us to evaluate the causal impact of WORD Force on student achievement outcomes as contrasted with BAU. EVERFI will offer WORD Force to the teachers in BAU as soon as the experiment is over. EVERFI will be able to use these findings to identify implementation factors that influence student outcomes, such as the classroom literacy environment, literacy block arrangements, and teachers’ characteristics. This study will also contribute to the growing corpus of literature around the efficacy of educational technology usage in early elementary classrooms.

For more information on our evaluation services, please visit our research services page and/or contact Robin Means.

All research Empirical Education has conducted for EVERFI can be found on our EVERFI webpage.

2023-04-13

Meet Our Newest Researchers

The Empirical Research Team is pleased to announce the addition of 3 new team members. We welcome Rebecca Dowling, Lindsay Maurer, and Mayah Waltower as our newest researchers!

Rebecca Dowling, Research Manager

Rebecca (box 8 in the pet matching game) is taking on the role of project manager for two evaluations. One is the EVERFI WORD Force project, working with Mayah Waltower. The other is the How Are The Children project. Rebecca’s PhD in Applied Developmental Psychology with a specialization in educational contexts of development lends expertise to both of these projects. Her education is complemented by her experience managing evaluations before joining Empirical Education. Rebecca works out of her home office in Utah. Can you guess which pet works at home with her?

Lindsay Maurer, Research Assistant

Lindsay (box 6 in the pet matching game) assists Sze-Shun Lau with the CREATE project, a teacher residency program in Atlanta Public Schools invested in expanding equity in education by developing critically conscious, compassionate, and skilled educators. Lindsay’s experience as a research assistant studying educational excellence and equality at the University of California Davis is an asset to the CREATE project. Lindsay works out of her home office in San Francisco, CA. Can you guess which pet works at home with her?

Mayah Waltower, Research Assistant

Mayah (box 1 in the pet matching game) has taken on assisting Rebecca with the EVERFI WORD Force and the How Are The Children projects. Mayah also assists Sze-Shun Lau with the CREATE project, a teacher residency program in Atlanta Public Schools invested in expanding equity in education by developing critically conscious, compassionate, and skilled educators. Mayah works out of her home office in Atlanta, GA. Can you guess which pet works at home with her?

To get to know them better, we’d like to invite you to play our pet matching game. The goal of the game is to correctly match each new team member with their pet (yes, plants can be pets too). To submit your answers and see if you’re right, post your guesses to twitter and tag us @empiricaled.

2023-03-17

We Won a SEED Grant in 2022 with Georgia State University

Empirical Education began serving as a program evaluator of the teacher residency program, Collaboration and Reflection to Enhance Atlanta Teacher Effectiveness (CREATE), in 2015 under a subcontract with Atlanta Neighborhood Charter Schools (ANCS) as part of their Investing in Innovation (i3) Development grant. In 2018, we extended this work with CREATE and Georgia State University through the Supporting Effective Educator Development (SEED) Grant Program, through the U.S. Department of Education. In 2020, we were awarded additional SEED grants to further extend our work with CREATE.

Last month, in October 2022, we were notified that this important work will receive continued funding through SEED. CREATE has proposed the following goals with this continued funding.

  • Goal 1: Recruit, support, retain compassionate, skilled, anti-racist educators via residency
  • Goal 2: Design and enact transformative learning opportunities for experienced educators, teacher educators, and local stakeholders
  • Goal 3: Sustain effective and financially viable models for educator recruitment, support, and retention
  • Goal 4: Ensure all research efforts are designed to benefit partner organizations

Empirical remains deeply committed to designing and executing a rigorous and independent evaluation that will inform partner organizations, local stakeholders, and a national audience of the potential impact and replicability of a multifaceted program that centers equity and wellness for educators and students. With this new grant, we are also committed to integrating more mixed method approaches to better align our evaluation with CREATE’s antiracist mission, and to contribute to recent conversations about what it means to conduct educational effectiveness work with an equity and social justice orientation.

Using a quasi-experimental design and mixed-methods process evaluation, we aim to understand the impact of CREATE on teachers’ equitable and effective classroom practices, student achievement, and teacher retention. We will also explore key mediating impacts, such as teacher well-being and self-compassion, and conduct a cost-effectiveness and cost-benefit analysis. Importantly, we want to explore the cost-benefit CREATE offers to local stakeholders, centering this work in the Atlanta community. This funding allows us to extend our evaluation through CREATE’s 10th cohort of residents, and to continue exploring the impact of CREATE on Cooperating Teachers and experienced educators in Atlanta Public Schools.

2023-02-06

Two New Studies for Regional Education Laboratory (REL) Southwest Completed

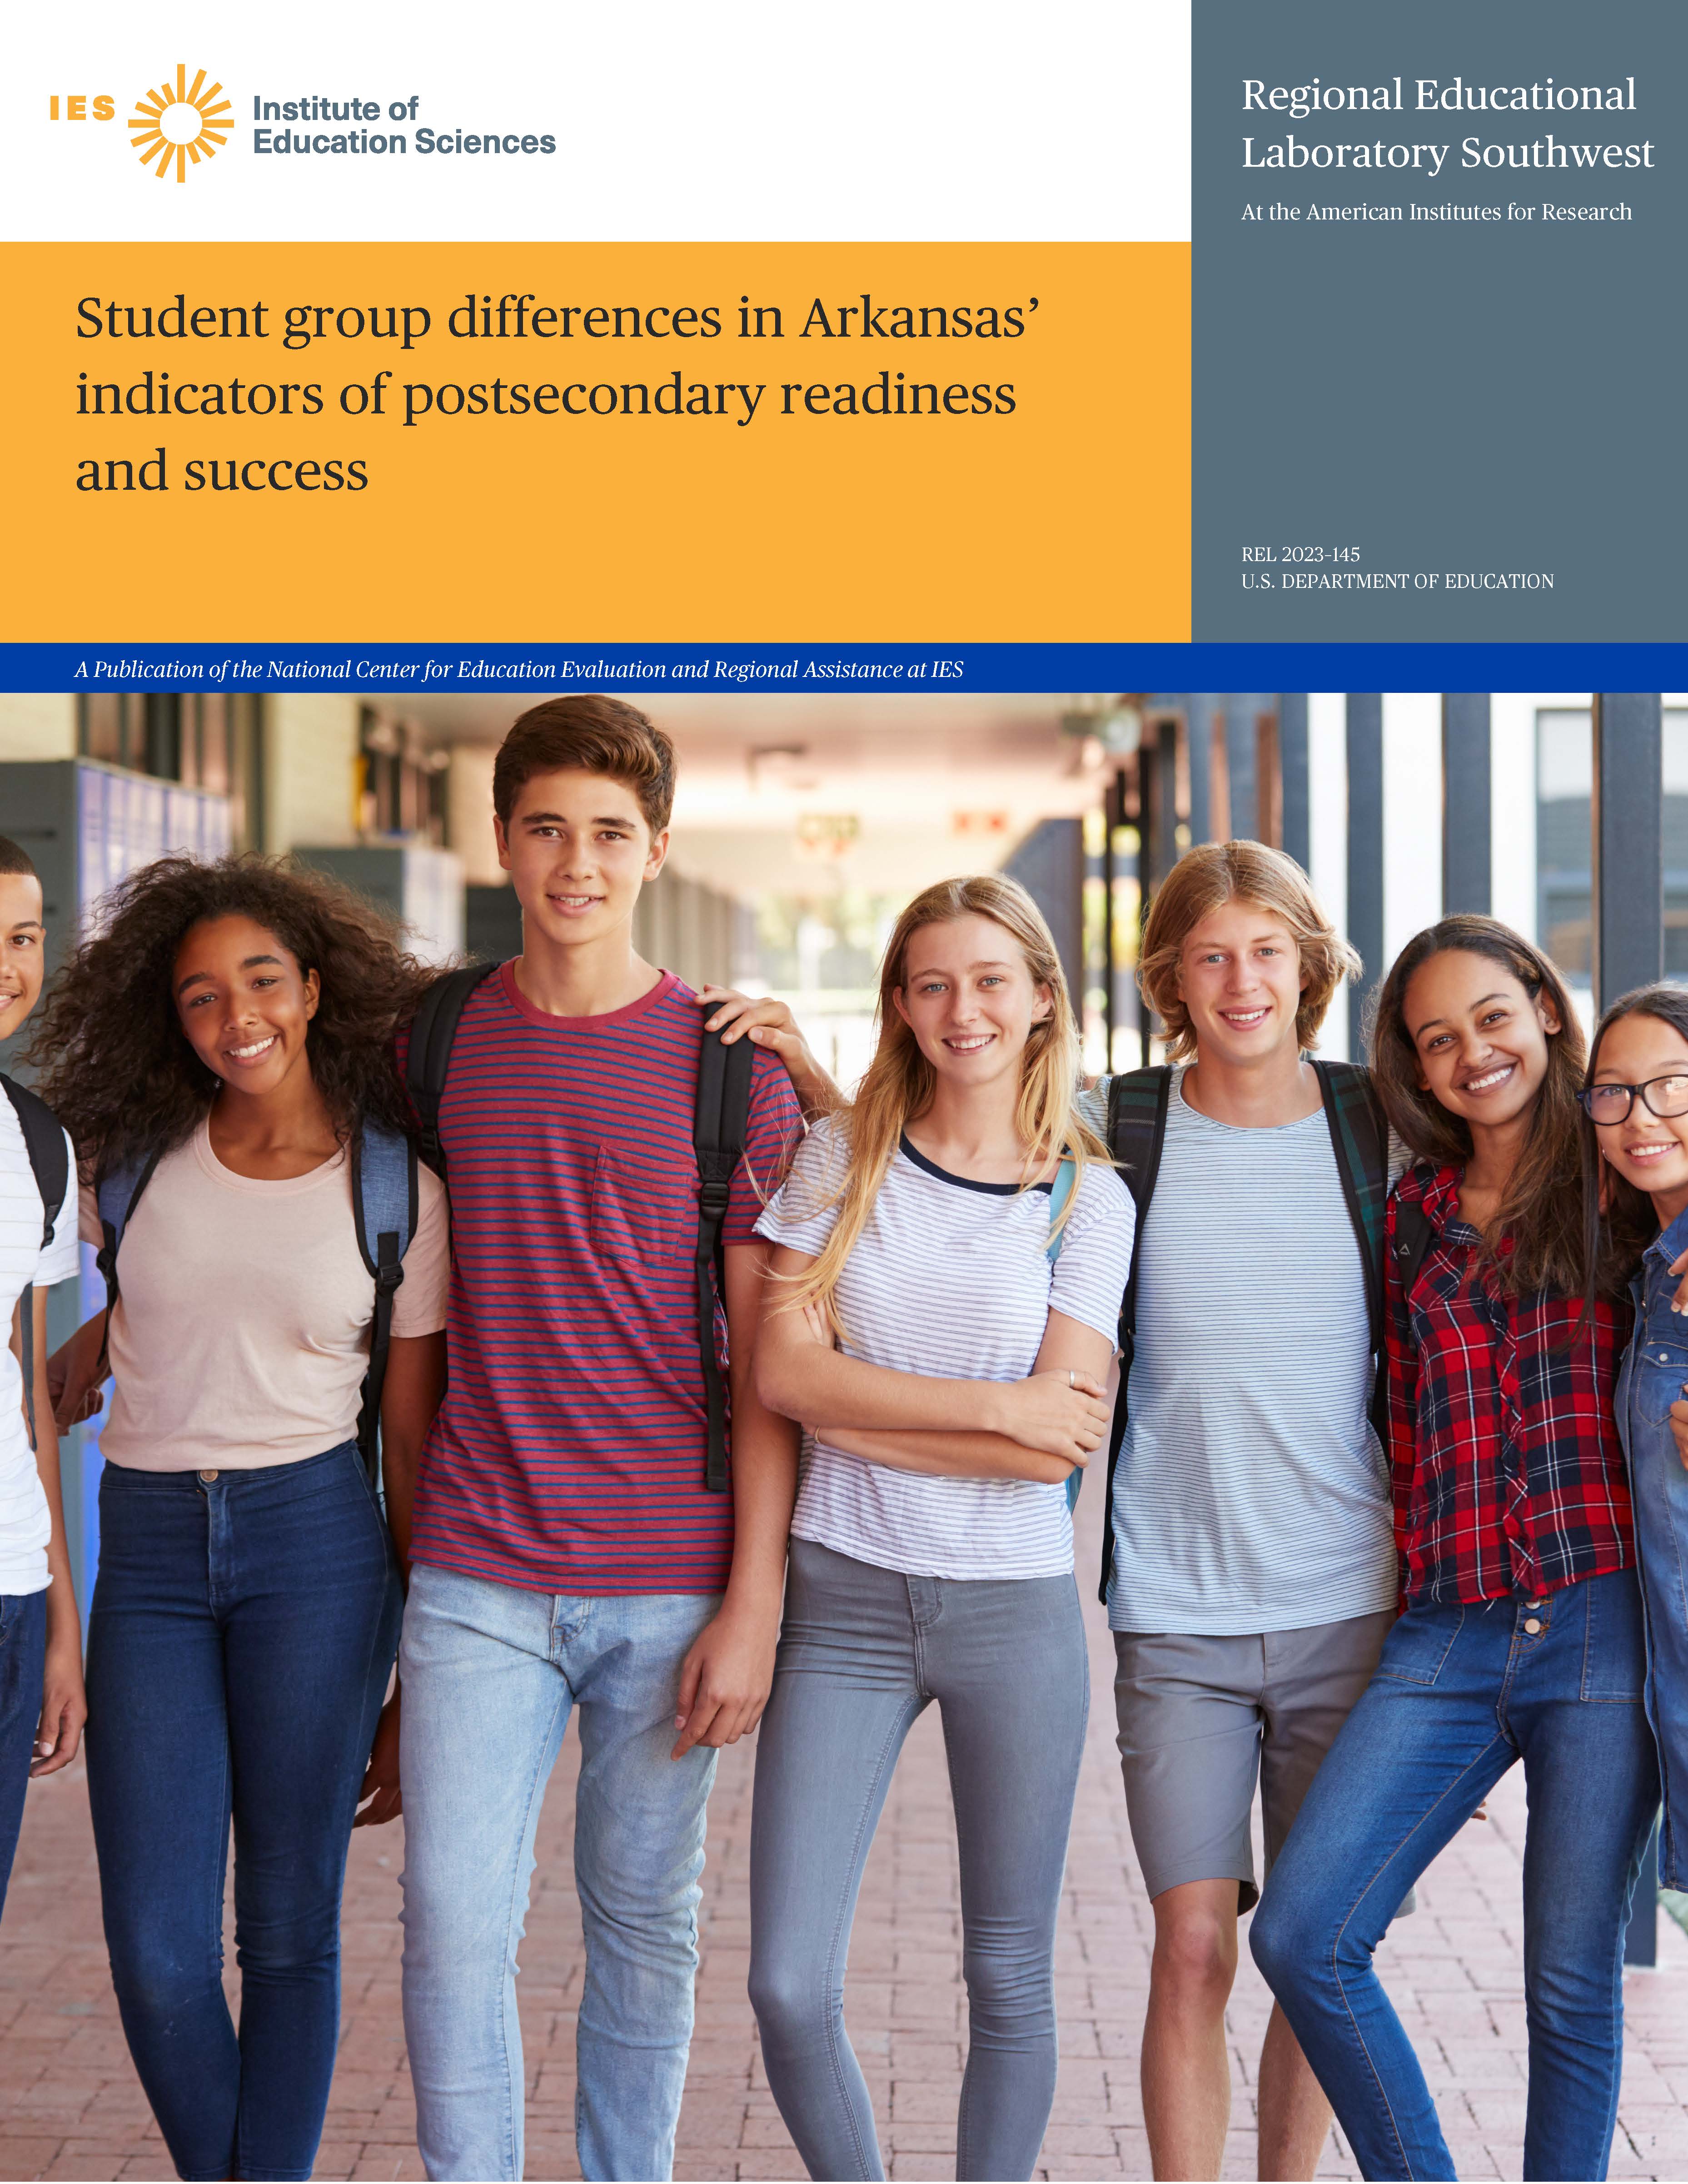
Student Group Differences in Arkansas Indicators of Postsecondary Readiness and Success

It is well documented that students from historically excluded communities face more challenges in school. They are often less likely to obtain postsecondary education, and as a result see less upward social mobility. Educational researchers and practitioners have developed policies aimed at disrupting this cycle. However, an important factor necessary to make these policies work is the ability of school administrators to identify students that are at risk of not reaching certain academic benchmarks and/or exhibit certain behavioral patterns that are correlated with future postsecondary success.

Arkansas Department of Education (ADE), like education authorities in many other states, is tracking K-12 students’ college readiness and enrollment and collecting a wide array of student progress indicators meant to predict their postsecondary success. A recent study by Regional Education Laboratory (REL) Southwest showed that a logistic regression model that uses a fairly small number of such indicators, measured as early as in seventh or eighth grade, predicts with a high degree of accuracy whether students will enroll in college four or five years later (Hester et al., 2021). But does this predictive model – and the entire “early warning” system that could rely on it – work equally well for all student groups? In general, predictive models are designed to reduce average prediction error. So, when the dataset used for predictive modeling covers several substantially different populations, the models tend to make more accurate predictions for the largest subset and less accurate for the rest of the observations. Meaning, if the sample your model relies on is mostly White, it will most accurately predict outcomes for White students. In addition, predictive strength of some indicators may vary across student groups. In practice, this means that such a model may turn out to be less useful to forecast the outcome for those students who should benefit the most from it

Researchers from Empirical Education and AIR teamed up to complete a study for REL Southwest that focuses on the differences in predictive strength and model accuracy across student groups. It was a massive analytical undertaking based on nine years of tracking two cohorts of six graders from the whole state, close to 80,000 records and hundreds of variables including student characteristics (including gender, race/ethnicity, eligibility for the National School Lunch Program, English learner student status, disability status, age, and district locale), middle and high school academic and behavioral indicators, and their interactions. First, we found that several student groups—including Black and Hispanic students, students eligible for the National School Lunch Program, English learner students, and students with disabilities—were substantially less likely (by 10 percentage points or more) to be ready for or enroll in college than students without these characteristics. However, our main finding, and a reassuring one, is that the model’s predictive power and predictive strength of most indicators is similar across student groups. In fact, the model often does a better job predicting postsecondary outcomes for those student groups in most need of support.

Let’s talk about what “better” means in a study like that. It is fair to say that statistical model quality is seldom of particular interest in educational research and is often limited to a footnote showing the value of R2 (the proportion of variation in the outcome explained by independent variables). It can tell us something about the amount of “noise” in the data, but it is hardly something that policy makers are normally concerned with. In the situation where the model’s ability to predict a binary outcome—whether or not the student went to college—is the primary concern, there is a clear need for an easily interpretable and actionable metric. We just need to know how often the model is likely to predict the future correctly based on current data.

Logistic regression, which is used for predicting binary outcomes, produces probabilities of outcomes. When the predicted probability (like that of college enrollment) is above fifty percent, then we say that it predicts success (“yes, this student will enroll”), and it predicts failure (“no, they will not enroll”) otherwise. When the actual outcomes are known, we can evaluate the accuracy of the model. Counting the cases in which the predicted outcome coincides with the actual one and dividing it by the total number of cases yields the overall model accuracy. The model accuracy is a useful metric that is typically reported in predictive studies with binary outcomes. We found, for example, that the model accuracy in predicting college persistence (students completing at least two years of college) is 70% when only middle school indicators are used as predictors, and it goes up to 75% when high school indicators are included. These statistics vary little across student groups, by no more than one or two percentage points. Although it is useful to know that outcomes two years after graduation from high school can be predicted with a decent accuracy in as early as eighth grade, the ultimate goal is to ensure that students at risk of failure are identified while schools still can provide them with necessary support. Unfortunately, such a metric as the model accuracy is not particularly helpful in this case.

Instead, a metric called “model specificity” in the parlance of predictive analytics lets us view the data from a different angle. It is calculated as a proportion of correctly predicted negative outcomes alone, ignoring the positive ones. The model specificity metric turns out to vary across student groups a lot in our study but the nature of this variation validates the ADE’s system: for the student groups in most need of support, the model specificity is higher than for the rest of the data. For some student groups, the model can detect that a student is not on track to postsecondary success with near certainty. For example, failure to attain college persistence is correctly predicted from middle school data in 91 percent of cases for English learner students compared to 65 percent for non-English learner students. Adding high school data into the mix lowers the gap—to 88 vs 76 percent—but specificity is still higher for the English learner students, and this pattern holds across all other student groups.

The predictive model used in the ADE study can certainly power an efficient early warning system. However, we need to keep in mind what those numbers mean. For some students from historically excluded communities, their early life experiences create significant obstacles down the road. Some high schools are not doing enough to put these students on a new track that would ensure college enrollment and graduation. It is also worth noting that while this study provides evidence that ADE has developed an effective system of indicators, the observations used in the study come from the two cohorts of students who were in the sixth graders in 2008–09 and 2009–10. Many socioeconomic conditions have changed since then. Thus, the only way to assure that the models remain accurate is to proceed from isolated studies to building “live” predictive tools that would update the models as soon as a new annual batch of outcome data becomes available.

Read complete report titled “Student Group Differences In Arkansas’ Indicators of Postsecondary Readiness and Success” here.

Early Progress and Outcomes of a Grow Your Own Grant Program for High School Students and Paraprofessionals in Texas

Shortage and high turnover of teachers is a problem that rural schools face across the nation. Empirical Education researchers have contributed to the search for solutions for this problem several times in recent years, including two studies completed for REL Southwest (Sullivan, et al., 2017; Lazarev et al., 2017). While much of the policy research is focused on the ways to recruit and retain credentialed teachers, some states are exploring novel methods to create new pathways into the profession that would help create new local teacher cadres. One such promising initiative is Grow Your Own (GYO) program funded by the Texas Education Agency (TEA). Starting in 2019, TEA provides grants to schools and districts that intend to expand the local teacher labor force through one or both of the following pathways. The first pathway offers high school students an early start in teacher preparation through a sequence of education and training courses. The second pathway aims to help paraprofessionals already employed by schools to transition into teaching positions by covering tuition for credentialing programs, as well as offering a stipend for living expenses.

In the joint project with AIR, Empirical Education researchers explored the potential of the first pathway for high school students to address teacher shortages in rural communities and to increase the diversity of teachers. Since this is a new program, our study was based on the first two years of implementation. We found promising evidence that GYO can positively impact rural communities and increase teacher diversity. For example, GYO grants were allocated primarily to rural and small town communities, and programs were implemented in smaller schools with a higher percentage of Hispanic students and economically disadvantaged students. Participating schools also had higher enrollment in the teacher preparation courses. In short, GYO seems to be reaching rural areas with smaller and more diverse schools, and is boosting enrollment in teacher preparation courses in these areas. However, we also found that fewer than 10% of students in participating districts completed at least one education and training course, and fewer than 1% of students completed the full sequence of courses. Additionally, white and female students are overrepresented in these courses. These and other preliminary results will help the state education agency to fine-tune the program and work toward a successful final result: a greater number and increased diversity of effective teachers who are from the community in which they teach. We look forward to continuing research on the impact of “Grow Your Own.”

Read complete report titled “Early Progress and Outcomes of a Grow Your Own Grant Program for High School Students and Paraprofessionals in Texas” here.

All research Empirical Education has conducted for REL Southwest can be found on our REL-SW webpage.

References

Hester, C., Plank, S., Cotla, C., Bailey, P., & Gerdeman, D. (2021). Identifying Indicators That Predict Postsecondary Readiness and Success in Arkansas. REL 2021-091. Regional Educational Laboratory Southwest. https://eric.ed.gov/?id=ED613040

Lazarev, V., Toby, M., Zacamy, J., Lin L., & Newman, D. (2017). Indicators of Successful Teacher Recruitment and Retention in Oklahoma Rural Schools (REL 2018–275). U.S. Department of Education, Institute of Education Sciences, National Center for Education Evaluation and Regional Assistance, Regional Educational Laboratory Southwest. https://ies.ed.gov/ncee/rel/Products/Publication/3872.

Sullivan, K., Barkowski, E., Lindsay, J., Lazarev, V., Nguyen, T., Newman, D., & Lin, L. (2017). Trends in Teacher Mobility in Texas and Associations with Teacher, Student, and School Characteristics (REL 2018–283). U.S. Department of Education, Institute of Education Sciences, National Center for Education Evaluation and Regional Assistance, Regional Educational Laboratory Southwest. https://ies.ed.gov/ncee/rel/Products/Publication/3883

2023-01-10

Introducing Our Newest Researchers

The Empirical Research Team is pleased to announce the addition of 2 new team members. We welcome Zahava Heydel and Chelsey Nardi on board as our newest researchers!

Zahava Heydel, Research Assistant

Zahava has taken on assisting Sze-Shun Lau with the CREATE project, a teacher residency program in Atlanta Public Schools invested in expanding equity in education by developing critically conscious, compassionate, and skilled educators.  Zahava’s experience as a research assistant at the University of Colorado Anschutz Medical Campus Department of Psychiatry, Colorado Center for Women’s Behavioral Health and Wellness is an asset to the Empirical Education team as we move toward evaluating SEL programs and individual student needs.

Chelsey Nardi, Research Manager

Chelsey is taking on the role of co-project manager for our evaluation of the CREATE project, working with Sze-Shun and Zahava. Chelsey is currently working toward her PhD exploring the application of antiracist theories in science education, which may support the evaluation of CREATE’s mission to develop critically conscious educators. Additionally, her research experience at McREL International and REL Pacific as a Research and Evaluation Associate has prepared her for managing some of our REL Southwest applied research projects. These experiences, coupled with her experience in project management, makes her an ideal fit for our team.

2021-10-04

Empirical Education Wraps Up Two Major i3 Research Studies

Empirical Education is excited to share that we recently completed two Investing In Innovation (i3) (now EIR) evaluations for the Making Sense of SCIENCE program and the Collaboration and Reflection to Enhance Atlanta Teacher Effectiveness (CREATE) programs. We thank the staff on both programs for their fantastic partnership. We also acknowledge Anne Wolf, our i3 technical assistance liaison from Abt Associates, as well as our Technical Working Group members on the Making Sense of SCIENCE project (Anne Chamberlain, Angela DeBarger, Heather Hill, Ellen Kisker, James Pellegrino, Rich Shavelson, Guillermo Solano-Flores, Steve Schneider, Jessaca Spybrook, and Fatih Unlu) for their invaluable contributions. Conducting these two large-scale, complex, multi-year evaluations over the last five years has not only given us the opportunity to learn much about both programs, but has also challenged our thinking—allowing us to grow as evaluators and researchers. We now reflect on some of the key lessons we learned, lessons that we hope will contribute to the field’s efforts in moving large-scale evaluations forward.

Background on Both Programs and Study Summaries

Making Sense of SCIENCE (developed by WestEd) is a teacher professional learning model aimed at increasing student achievement through improving instruction and supporting districts, schools, and teachers in their implementation of the Next Generation Science Standards (NGSS). The key components of the model include building leadership capacity and providing teacher professional learning. The program’s theory of action is based on the premise that professional learning that is situated in an environment of collaborative inquiry and supported by school and district leadership produces a cascade of effects on teachers’ content and pedagogical content knowledge, teachers’ attitudes and beliefs, the school climate, and students’ opportunities to learn. These effects, in turn, yield improvements in student achievement and other non-academic outcomes (e.g., enjoyment of science, self-efficacy, and agency in science learning). NGSS had just been introduced two years prior to the study, a study which ran from 2015 through 2018. The infancy of NGSS and the resulting shifting landscape of science education posed a significant challenge to our study, which we discuss below.

Our impact study of Making Sense of SCIENCE was a cluster-randomized, two-year evaluation involving more than 300 teachers and 8,000 students. Confirmatory impact analyses found a positive and statistically significant impact on teacher content knowledge. While impact results on student achievement were mostly all positive, none reached statistical significance. Exploratory analyses found positive impacts on teacher self-reports of time spent on science instruction, shifts in instructional practices, and amount of peer collaboration. Read our final report here.

CREATE is a three-year teacher residency program for students of Georgia State University College of Education and Human Development (GSU CEHD) that begins in their last year at GSU and continues through their first two years of teaching. The program seeks to raise student achievement by increasing teacher effectiveness and retention of both new and veteran educators by developing critically-conscious, compassionate, and skilled educators who are committed to teaching practices that prioritize racial justice and interrupt inequities.

Our impact study of CREATE used a quasi-experimental design to evaluate program effects for two staggered cohorts of study participants (CREATE and comparison early career teachers) from their final year at GSU CEHD through their second year of teaching, starting with the first cohort in 2015–16. Confirmatory impact analyses found no impact on teacher performance or on student achievement. However, exploratory analyses revealed a positive and statistically significant impact on continuous retention over a three-year time period (spanning graduation from GSU CEHD, entering teaching, and retention into the second year of teaching) for the CREATE group, compared to the comparison group. We also observed that higher continuous retention among Black educators in CREATE, relative to those in the comparison group, is the main driver of the favorable impact. The fact that the differential impacts on Black educators were positive and statistically significant for measures of executive functioning (resilience) and self-efficacy—and marginally statistically significant for stress management related to teaching—hints at potential mediators of impact on retention and guides future research.

After the i3 program funded this research, Empirical Education, GSU CEHD, and CREATE received two additional grants from the U.S. Department of Education’s Supporting Educator Effectiveness Development (SEED) program for further study of CREATE. We are currently studying our sixth cohort of CREATE residents and will have studied eight cohorts of CREATE residents, five cohorts of experienced educators, and two cohorts of cooperating teachers by the end of the second SEED grant. We are excited to continue our work with the GSU and CREATE teams and to explore the impact of CREATE, especially for retention of Black educators. Read our final report for the i3 evaluation of CREATE here.

Lessons Learned

While there were many lessons learned over the past five years, we’ll highlight two that were particularly challenging and possibly most pertinent to other evaluators.

The first key challenge that both studies faced was the availability of valid and reliable instruments to measure impact. For Making Sense of SCIENCE, a measure of student science achievement that was aligned with NGSS was difficult to identify because of the relative newness of the standards, which emphasized three-dimensional learning (disciplinary core ideas, science and engineering practices, and cross-cutting concepts). This multi-dimensional learning stood in stark contrast to the existing view of science education at the time, which primarily focused on science content. In 2014, one year prior to the start of our study, the National Research Council pointed out that “the assessments that are now in wide use were not designed to meet this vision of science proficiency and cannot readily be retrofitted to do so” (NRC, 2014, page 12). While state science assessments that existed at the time were valid and reliable, they focused on science content and did not measure the type of three-dimensional learning targeted by NGSS. The NRC also noted that developing new assessments would “present[s] complex conceptual, technical, and practical challenges, including cost and efficiency, obtaining reliable results from new assessment types, and developing complex tasks that are equitable for students across a wide range of demographic characteristics” (NRC, 2014, p.16).

Given this context, despite the research team’s extensive search for assessments from a variety of sources—including reaching out to state departments of education, university-affiliated assessment centers, and test developers—we could not find an appropriate instrument. Using state assessments was not an option. The states in our study were still in the process of either piloting or field testing assessments that were aligned to NGSS or to state standards based on NGSS. This void of assessments left the evaluation team with no choice but to develop one, independently of the program developer, using established items from multiple sources to address general specifications of NGSS, and relying on the deep content expertise of some members of the research team. Of course there were some risks associated with this, especially given the lack of opportunity to comprehensively pilot or field test the items in the context of the study. When used operationally, the researcher-developed assessment turned out to be difficult and was not highly discriminating of ability at the low end of the achievement scale, which may have influenced the small effect size we observed. The circumstances around the assessment and the need to improvise a measure leads us to interpret findings related to science achievement of the Making Sense of SCIENCE program with caution.

The CREATE evaluation also faced a measurement challenge. One of the two confirmatory outcomes in the study was teacher performance, as measured by ratings of teachers by school administrators on two of the state’s Teacher Assessment on Performance Standards (TAPS), which is a component of the state’s evaluation system (Georgia Department of Education, 2021). We could not detect impact on this measure because the variance observed in the ordinal ratings was remarkably low, with ratings overwhelmingly centered on the median value. This was not a complete surprise. The literature documents this lack of variability in teaching performance ratings. A seminal report, The Widget Effect by The New Teacher Project (Weisberg et al., 2009), called attention to this “national crisis”—the inability of schools to effectively differentiate among low- and high-performing teachers. The report showed that in districts that use binary evaluation ratings, as well as those that use a broader range of rating options, less than 1% of teachers received a rating of unsatisfactory. In the CREATE study, the median value was chosen overwhelmingly. In a study examining teacher performance ratings by Kraft and Gilmour (2017), principals in that study explained that they were more reluctant to give new teachers a rating below proficient because they acknowledge that new teachers were still working to improve their teaching, and that “giving a low rating to a potentially good teacher could be counterproductive to a teacher’s development.” These reasons are particularly relevant to the CREATE study given that the teachers in our study are very early in their teaching career (first year teachers), and given the high turnover rate of all teachers in Georgia.

We bring up this point about instruments as a way to share with the evaluation community what we see as a not uncommon challenge. In 2018 (the final year of outcomes data collection for Making Sense of SCIENCE), when we presented about the difficulties of finding a valid and reliable NGSS-aligned instrument at AERA, a handful of researchers approached us to commiserate; they too were experiencing similar challenges with finding an established NGSS-aligned instrument. As we write this, perhaps states and testing centers are further along in their development of NGSS-aligned assessments. However, the challenge of finding valid and reliable instruments, generally speaking, will persist as long as educational standards continue to evolve. (And they will.) Our response to this challenge was to be as transparent as possible about the instruments and the conclusions we can draw from using them. In reporting on Making Sense of SCIENCE, we provided detailed descriptions of our process for developing the instruments and reported item- and form-level statistics, as well as contextual information and rationale for critical decisions. In reporting on CREATE, we provided the distribution of ratings on the relevant dimensions of teacher performance for both the baseline and outcome measures. In being transparent, we allow the readers to draw their own conclusions from the data available, facilitate the review of the quality of the evidence against various sets of research standards, support replication of the study, and provide further context for future study.

A second challenge was maintaining a consistent sample over the course of the implementation, particularly in multi-year studies. For Making Sense of SCIENCE, which was conducted over two years, there was substantial teacher mobility into and out of the study. Given the reality of schools, even with study incentives, nearly half of teachers moved out of study schools or study-eligible grades within schools over the two year period of the study. This obviously presented a challenge to program implementation. WestEd delivered professional learning as intended, and leadership professional learning activities all met fidelity thresholds for attendance, with strong uptake of Making Sense of SCIENCE within each year (over 90% of teachers met fidelity thresholds). Yet, only slightly more than half of study teachers met the fidelity threshold for both years. The percentage of teachers leaving the school was congruous with what we observed at the national level: only 84% of teachers stay as a teacher at the same school year-over-year (McFarland et al., 2019). For assessing impacts, the effects of teacher mobility can be addressed to some extent at the analysis stage; however, the more important goal is to figure out ways to achieve fidelity of implementation and exposure for the full program duration. One option is to increase incentivization and try to get more buy-in, including among administration, to allow more teachers to reach the two-year participation targets by retaining teachers in subjects and grades to preserve their eligibility status in the study. This solution may go part way because teacher mobility is a reality. Another option is to adapt the program to make it shorter and more intensive. However, this option may work against the core model of the program’s implementation, which may require time for teachers to assimilate their learning. Yet another option is to make the program more adaptable; for example, by letting teachers who leave eligible grades and school to continue to participate remotely, allowing impacts to be assessed over more of the initially randomized sample.

For CREATE, sample size was also a challenge, but for slightly different reasons. During study design and recruitment, we had anticipated and factored the estimated level of attrition into the power analysis, and we successfully recruited the targeted number of teachers. However, several unexpected limitations arose during the study that ultimately resulted in small analytic samples. These limitations included challenges in obtaining research permission from districts and schools (which would have allowed participants to remain active in the study), as well as a loss of study participants due to life changes (e.g., obtaining teaching positions in other states, leaving the teaching profession completely, or feeling like they no longer had the time to complete data collection activities). Also, while Georgia administers the Milestones state assessment in grades 4–8, many participating teachers in both conditions taught lower elementary school grades or non-tested subjects. For the analysis phase, many factors resulted in small student samples: reduced teacher samples, the technical requirement of matching students across conditions within each cohort in order to meet WWC evidence standards, and the need to match students within grades, given the lack of vertically scaled scores. While we did achieve baseline equivalence between the CREATE and comparison groups for the analytic samples, the small number of cases greatly reduced the scope and external validity of the conclusions related to student achievement. The most robust samples were for retention outcomes. We have the most confidence in those results.

As a last point of reflection, we greatly enjoyed and benefited from the close collaboration with our partners on these projects. The research and program teams worked together in lockstep at many stages of the study. We also want to acknowledge the role that the i3 grant played in promoting the collaboration. For example, the grant’s requirements around the development and refinement of the logic model was a major driver of many collaborative efforts. Evaluators reminded the team periodically about the “accountability” requirements, such as ensuring consistency in the definition and use of the program components and mediators in the logic model. The program team, on the other hand, contributed contextual knowledge gained through decades of being intimately involved in the program. In the spirit of participatory evaluation, the two teams benefited from the type of organization learning that “occurs when cognitive systems and memories are developed and shared by members of the organizations” (Cousins & Earl, 1992). This type of organic and fluid relationship encouraged the researchers and program teams to embrace uncertainty during the study. While we “pre-registered” confirmatory research questions for both studies by submitting the study plans to NEi3 prior to the start of the studies, we allowed exploratory questions to be guided by conversations with the program developers. In doing so, we were able to address questions that were most useful to the program developers and the districts and schools implementing the programs.

We are thankful that we had the opportunity to conduct these two rigorous evaluations alongside such humble, thoughtful, and intentional (among other things!) program teams over the last five years, and we look forward to future collaborations. These two evaluations have both broadened and deepened our experience with large-scale evaluations, and we hope that our reflections here not only serve as lessons for us, but that they may also be useful to the education evaluation community at large, as we continue our work in the complex and dynamic education landscape.

References

Cousins, J. B., & Earl, L. M. (1992). The case for participatory evaluation. Educational Evaluation and Policy Analysis, 14(4), 397-418.

Georgia Department of Education (2021). Teacher Keys Effectiveness System. https://www.gadoe.org/School-Improvement/Teacher-and-Leader-Effectiveness/Pages/Teacher-Keys-Effectiveness-System.aspx

Kraft, M. A., & Gilmour, A. F. (2017). Revisiting the widget effect: Teacher evaluation reforms and the distribution of teacher effectiveness. Educational Researcher, 46(5), 234-249.

McFarland, J., Hussar, B., Zhang, J., Wang, X., Wang, K., Hein, S., Diliberti, M., Forrest Cataldi, E., Bullock Mann, F., and Barmer, A. (2019). The Condition of Education 2019 (NCES 2019-144). U.S. Department of Education. National Center for Education Statistics. https://nces.ed.gov/pubsearch/pubsinfo.asp?pubid=2019144

National Research Council (NRC). (2014). Developing Assessments for the Next Generation Science Standards. Committee on Developing Assessments of Science Proficiency in K-12. Board on Testing and Assessment and Board on Science Education, J.W. Pellegrino, M.R. Wilson, J.A. Koenig, and A.S. Beatty, Editors. Division of Behavioral and Social Sciences and Education. The National Academies Press.

Weisberg, D., Sexton, S., Mulhern, J., & Keeling, D. (2009). The Widget Effect: Our National Failure to Acknowledge and Act on Differences in Teacher Effectiveness. The New Teacher Project. https://tntp.org/wp-content/uploads/2023/02/TheWidgetEffect_2nd_ed.pdf

2021-06-23

Instructional Coaching: Positive Impacts on Edtech Use and Student Learning

In 2019, Digital Promise contracted with Empirical Education to evaluate the impact of the Dynamic Learning Project (DLP) on teacher and student edtech usage and on student achievement. DLP provided school-based instructional technology coaches with mentoring and professional developing, with the goal to increase educational equity and impactful use of technology. You may have seen the blog post we published in summer 2020 announcing the release of our design memo for the study. The importance of this project was magnified during the pandemic-induced shift to an increased use of online tools. 

The results of the study are summarized in this research brief published last month. We found evidence of positive impacts on edtech use and student learning across three districts involved in DLP.  

These findings make a contribution to the evidence base for how to drive meaningful technology use in schools. This should continue to be an area of investigation for future studies; districts focused on equity and inclusion must ensure that edtech is adopted broadly across teacher and student populations.

2021-04-28
Archive