blog posts and news stories

The Rebel Alliance is Growing

The rebellion against the old NCLB way of doing efficacy research is gaining force. A growing community among edtech developers, funders, researchers, and school users has been meeting in an attempt to reach a consensus on an alternative built on ESSA.

This is being assisted by openness in the directions currently being pursued by IES. In fact, we are moving into a new phase marked by two-way communication with the regime. While the rebellion hasn’t yet handed over its lightsabers, it is encouraged by the level of interest from prominent researchers.

From these ongoing discussions, there have been some radical suggestions inching toward consensus. A basic idea now being questioned is this:

The difference between the average of the treatment group and the average of the control group is a valid measure of effectiveness.

There are two problems with this:

  1. In schools, there’s no “placebo” or something that looks like a useful program but is known to have zero effectiveness. Whatever is going on in the schools, or classes, or with teachers and students in the control condition has some usefulness or effectiveness. The usefulness of the activities in the control classes or schools may be greater than the activities being evaluated in the study, or may be not as useful. The study may find that the “effectiveness” of the activities being studied is positive, negative, or too small to be discerned statistically by the study. In any case, the size (negative or positive) of the effect is determined as much by what’s being done in the control group as the treatment group.
  2. Few educational activities have the same level of usefulness for all teachers and students. Looking at only the average will obscure the differences. For example, we ran a very large study for the U.S. Department of Education of a STEM program where we found, on average, the program was effective. What the department didn’t report was that it only worked for the white kids, not the black kids. The program increased instead of reducing the existing achievement gap. If you are considering adopting this STEM program, the impact on the different subgroups is relevant–a high minority school district may want to avoid it. Also, to make the program better, the developers need to know where it works and where it doesn’t. Again, the average impact is not just meaningless but also can be misleading.

A solution to the overuse of the average difference from studies is to conduct a lot more studies. The price the ED paid for our large study could have paid for 30 studies of the kind we are now conducting in the same state of the same program; in 10% of the time of the original study. If we had 10 different studies for each program, where studies are conducted in different school districts with different populations and levels of resources, the “average” across these studies start to make sense. Importantly, the average across these 10 studies for each of the subgroups will give a valid picture of where, how, and with which students and teachers the program tends to work best. This kind of averaging used in research is called meta-analysis and allows many small differences found across studies to build on the power of each study to generate reliable findings.

If developers or publishers of the products being used in schools took advantage of their hundreds of implementations to gather data, and if schools would be prepared to share student data for this research, we could have researcher findings that both help schools decide what will likely work for them and help developers improve their products.

2018-09-21

New Project with ALSDE to Study AMSTI

Empirical Education is excited to announce a new study of the Alabama Math, Science, and Technology Initiative (AMSTI). The Alabama legislature commissioned the study. AMSTI is the Alabama State Department of Education’s initiative to improve math and science teaching statewide. The program, which started over 20 years ago, operates in over 900 schools across the state. Many external evaluators have validated AMSTI.

Researchers here at Empirical Education, directed by Chief Scientist Andrew Jaciw, published a study in 2012. The cluster-randomized trial (CRCT) involved 82 schools and ~700 teachers. It assessed the efficacy of AMSTI over a three year period and showed an overall positive effect (Newman et al., 2012).

The new study that we are embarking on will use a quasi-experimental matched comparison group design. We will take advantage of existing data available from the Alabama State Department of Education and the AMSTI program. By comparing compare schools using AMSTI to matched schools not using AMSTI, we can determine the impact of the program on math and science achievement for students in grades 3 through 8. Our report will also include differential impacts of the program on important student subgroups. Using Improvement Science principles, we will examine school climates for a greater or reduced program impact.

At the conclusion of the study, we will distribute the report to select committees of the Alabama state legislature, the Governor and the Alabama State Board of Education, and the Alabama State Department of Education. Empirical Education researchers will travel to Montgomery, AL to present the study findings and recommendations for improvement to the Alabama legislature.

2018-07-13

A Rebellion Against the Current Research Regime

Finally! There is a movement to make education research more relevant to educators and edtech providers alike.

At various conferences, we’ve been hearing about a rebellion against the “business as usual” of research, which fails to answer the question of, “Will this product work in this particular school or community?” For educators, the motive is to find edtech products that best serve their students’ unique needs. For edtech vendors, it’s an issue of whether research can be cost-effective, while still identifying a product’s impact, as well as helping to maximize product/market fit.

The “business as usual” approach against which folks are rebelling is that of the U.S. Education Department (ED). We’ll call it the regime. As established by the Education Sciences Reform Act of 2002 and the Institute of Education Sciences (IES), the regime anointed the randomized control trial (or RCT) as the gold standard for demonstrating that a product, program, or policy caused an outcome.

Let us illustrate two ways in which the regime fails edtech stakeholders.

First, the regime is concerned with the purity of the research design, but not whether a product is a good fit for a school given its population, resources, etc. For example, in an 80-school RCT that the Empirical team conducted under an IES contract on a statewide STEM program, we were required to report the average effect, which showed a small but significant improvement in math scores (Newman et al., 2012). The table on page 104 of the report shows that while the program improved math scores on average across all students, it didn’t improve math scores for minority students. The graph that we provide here illustrates the numbers from the table and was presented later at a research conference.
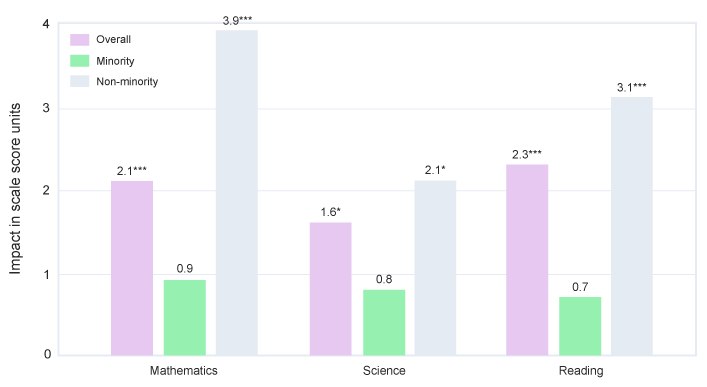
bar graph representing math, science, and reading scores for minority vs non-minority students

IES had reasons couched in experimental design for downplaying anything but the primary, average finding, however this ignores the needs of educators with large minority student populations, as well as of edtech vendors that wish to better serve minority communities.

Our RCT was also expensive and took many years, which illustrates the second failing of the regime: conventional research is too slow for the fast-moving innovative edtech development cycles, as well as too expensive to conduct enough research to address the thousands of products out there.

These issues of irrelevance and impracticality were highlighted last year in an “academic symposium” of 275 researchers, edtech innovators, funders, and others convened by the organization now called Jefferson Education Exchange (JEX). A popular rallying cry coming out of the symposium is to eschew the regime’s brand of research and begin collecting product reviews from front-line educators. This would become a Consumer Reports for edtech. Factors associated with differences in implementation are cited as a major target for data collection. Bart Epstein, JEX’s CEO, points out: “Variability among and between school cultures, priorities, preferences, professional development, and technical factors tend to affect the outcomes associated with education technology. A district leader once put it to me this way: ‘a bad intervention implemented well can produce far better outcomes than a good intervention implemented poorly’.”

Here’s why the Consumer Reports idea won’t work. Good implementation of a program can translate into gains on outcomes of interest, such as improved achievement, reduction in discipline referrals, and retention of staff, but only if the program is effective. Evidence that the product caused a gain on the outcome of interest is needed or else all you measure is the ease of implementation and student engagement. You wouldn’t know if the teachers and students were wasting their time with a product that doesn’t work.

We at Empirical Education are joining the rebellion. The guidelines for research on edtech products we recently prepared for the industry and made available here is a step toward showing an alternative to the regime while adopting important advances in the Every Student Succeeds Act (ESSA).

We share the basic concern that established ways of conducting research do not answer the basic question that educators and edtech providers have: “Is this product likely to work in this school?” But we have a different way of understanding the problem. From years of working on federal contracts (often as a small business subcontractor), we understand that ED cannot afford to oversee a large number of small contracts. When there is a policy or program to evaluate, they find it necessary to put out multi-million-dollar, multi-year contracts. These large contracts suit university researchers, who are not in a rush, and large research companies that have adjusted their overhead rates and staffing to perform on these contracts. As a consequence, the regime becomes focused on the perfection in the design, conduct, and reporting of the single study that is intended to give the product, program, or policy a thumbs-up or thumbs-down.

photo of students in a classroom on computers

There’s still a need for a causal research design that can link conditions such as resources, demographics, or teacher effectiveness with educational outcomes of interest. In research terminology, these conditions are called “moderators,” and in most causal study designs, their impact can be measured.

The rebellion should be driving an increase the number of studies by lowering their cost and turn-around time. Given our recent experience with studies of edtech products, this reduction can reach a factor of 100. Instead of one study that costs $3 million and takes 5 years, think in terms of a hundred studies that cost $30,000 each and are completed in less than a month. If for each product, there are 5 to 10 studies that are combined, they would provide enough variation and numbers of students and schools to detect differences in kinds of schools, kinds of students, and patterns of implementation so as to find where it works best. As each new study is added, our understanding of how it works and with whom improves.

It won’t be enough to have reviews of product implementation. We need an independent measure of whether—when implemented well—the intervention is capable of a positive outcome. We need to know that it can make (i.e., cause) a difference AND under what conditions. We don’t want to throw out research designs that can detect and measure effect sizes, but we should stop paying for studies that are slow and expensive.

Our guidelines for edtech research detail multiple ways that edtech providers can adapt research to better work for them, especially in the era of ESSA. Many of the key recommendations are consistent with the goals of the rebellion:

  • The usage data collected by edtech products from students and teachers gives researchers very precise information on how well the program was implemented in each school and class. It identifies the schools and classes where implementation met the threshold for which the product was designed. This is a key to lowering cost and turn-around time.
  • ESSA offers four levels of evidence which form a developmental sequence, where the base level is based on existing learning science and provides a rationale for why a school should try it. The next level looks for a correlation between an important element in the rationale (measured through usage of that part of the product) and a relevant outcome. This is accepted by ESSA as evidence of promise, informs the developers how the product works, and helps product marketing teams get the right fit to the market. a pyramid representing the 4 levels of ESSA
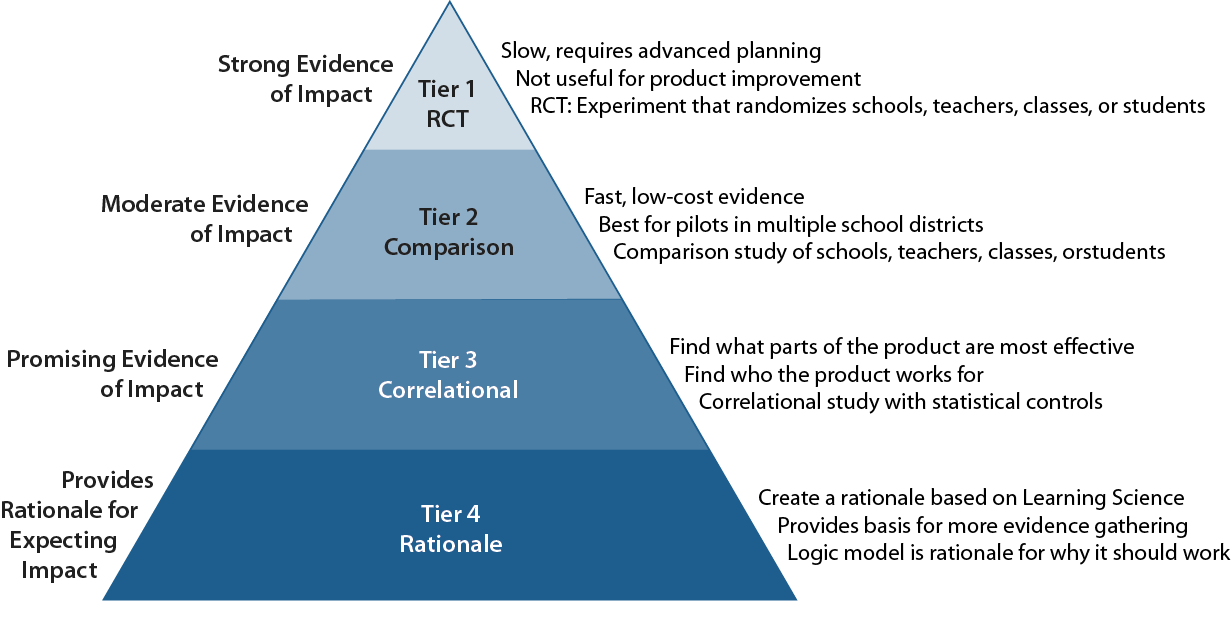
  • The ESSA level that provides moderate evidence that the product caused the observed impact requires a comparison group matched to the students or schools that were identified as the users. The regime requires researchers to report only the difference between the user and comparison groups on average. Our guidelines insist that researchers must also estimate the extent to which an intervention is differentially effective for different demographic categories or implementation conditions.

From the point of view of the regime, nothing in these guidelines actually breaks the rules and regulations of ESSA’s evidence standards. Educators, developers, and researchers should feel empowered to collect data on implementation, calculate subgroup impacts, and use their own data to generate evidence sufficient for their own decisions.

A version of this article was published in the Edmarket Essentials magazine.

2018-05-09

2010-2011: The Year of the VAM

If you haven’t heard about Value-Added Modeling (VAM) in relation to the controversial teacher ratings in Los Angeles and subsequent brouhaha in the world of education, chances are that you’ll hear about it in the coming year.

VAM is a family of statistical techniques for estimating the contribution of a teacher or of a school to the academic growth of students. Recently, the LA Times obtained the longitudinal test score records for all the elementary school teachers and students in LA Unified and had a RAND economist (working as an independent consultant) run the calculations. The result was a “score” for all LAUSD elementary school teachers.

Reactions to the idea that a teacher could be evaluated using a set of test scores—in this case from the California Standards Test—were swift and divisive. The concept was denounced by the teachers’ union, with the local leader calling for a boycott. Meanwhile, the US Secretary of Education, Arne Duncan, made headlines by commenting favorably on the idea. The LA Times quotes him as saying “What’s there to hide? In education, we’ve been scared to talk about success.”

There is a tangle of issues here, along with exaggerations, misunderstandings, and confusion between research techniques and policy decisions. This column will address some of the issues over the coming year. We also plan to announce some of our own contributions to the VAM field in the form of project news.

The major hot-button issues include appropriate usage (e.g., for part or all of the input to merit pay decisions) and technical failings (e.g., biases in the calculations). Of course, these two issues are often linked; for example, many argue that biases may make VAM unfair for individual merit pay. The recent Brief from the Economic Policy Institute, authored by an impressive team of researchers (several our friends/mentors from neighboring Stanford), makes a well reasoned case for not using VAM as the only input to high-stakes decisions. While their arguments are persuasive with respect to VAM as the lone criterion for awarding merit pay or firing individual teachers, we still see a broad range of uses for the technique, along with the considerable challenges.

For today, let’s look at one issue that we find particularly interesting: How to handle teacher collaboration in a VAM framework. In a recent Education Week commentary, Kim Marshall argues that any use of test scores for merit pay is a losing proposition. One of the many reasons he cites is its potentially negative impact on collaboration.

A problem with an exercise like that conducted by the LA Times is that there are organizational arrangements that do not come into the calculations. For example, we find that team teaching within a grade at a school is very common. A teacher with an aptitude for teaching math may take another teacher’s students for a math period, while sending her own kids to the other teacher for reading. These informal arrangements are not part of the official school district roster. They can be recorded (with some effort) during the current year but are lost for prior years. Mentoring is a similar situation, wherein the value provided to the kids is distributed among members of their team of teachers. We don’t know how much difference collaborative or mentoring arrangements make to individual VAM scores, but one fear in using VAM in setting teacher salaries is that it will militate against productive collaborations and reduce overall achievement.

Some argue that, because VAM calculations do not properly measure or include important elements, VAM should be disqualified from playing any role in evaluation. We would argue that, although they are imperfect, VAM calculations can still be used as a component of an evaluation process. Moreover, continued improvements can be made in testing, in professional development, and in the VAM calculations themselves. In the case of collaboration, what is needed are ways that a principal can record and evaluate the collaborations and mentoring so that the information can be worked into the overall evaluation and even into the VAM calculation. In such an instance, it would be the principal at the school, not an administrator at the district central office, who can make the most productive use of the VAM calculations. With knowledge of the local conditions and potential for bias, the building leader may be in the best position to make personnel decisions.

VAM can also be an important research tool—using consistently high and/or low scores as a guide for observing classroom practices that are likely to be worth promoting through professional development or program implementations. We’ve seen VAM used this way, for example, by the research team at Wake County Public Schools in North Carolina in identifying strong and weak practices in several content areas. This is clearly a rich area for continued research.

The LA Times has helped to catapult the issue of VAM onto the national radar. It has also sparked a discussion of how school data can be used to support local decisions, which can’t be a bad thing.

2010-09-18

New Education Pilot Brings Apple’s iPad Into the Classroom

Above: Empirical Education President Denis Newman converses with Secretary Bonnie Reiss and author, Dr. Edward Burger

They’re not contest winners, but today, dozens of lucky 8th grade Algebra 1 students enthusiastically received new iPad devices, as part of a pilot of the new technology.

California Secretary of Education Bonnie Reiss joined local officials, publishers, and researchers at Washington Middle School in Long Beach for the kick-off. Built around this pilot is a scientific study designed to test the effectiveness of a new iPad-delivered Algebra textbook. Over the course of the new school year, Empirical Education researchers will compare the effect of the interactive iPad-delivered textbook to that of its conventional paper counterpart.

The new Algebra I iPad Application is published by Houghton Mifflin Harcourt and features interactive lessons, videos, quizzes, problem solving, and more. While students have to flip pages in a traditional textbook to reveal answers and explanations, students using the iPad version will be able to view interactive explanations and study guides instantly by tapping on the screen. Researchers will be able to study data collected from usage logs to enhance their understanding of usage patterns.

Empirical Education is charged with conducting the study, which will incorporate the performance of over twelve hundred students from four school districts throughout California, including Long Beach, San Francisco, Riverside, and Fresno. Researchers will combine measures of math achievement and program implementation to estimate the new program’s advantage while accounting for the effects of teacher differences and other influences on implementation and student achievement. Each participating teacher has one randomly selected class using the iPads while the other classes continue with the text version of the same material.

Though the researchers haven’t come up with a way of dealing with jealousy from students who will not receive an iPad, they did come up with a fair way to choose the groups who would use the new high tech program. Classes who received iPads were determined by a random number generator.

2010-09-08

Reports Released on the Effect of Carnegie Learning’s Cognitive Tutor

The Maui School District has released results from a study of the effect of Carnegie Learning’s Cognitive Tutor (CT) on long-term course selections and grade performance. Building upon two previous randomized experiments on the impact of CT on student achievement in Algebra I and Pre–algebra, the study followed the same groups of students in the year following their exposure to CT. The research did not find evidence of an impact of CT on either course selection or course grade performance for students in the following school year. The study also found no evidence that variation among ethnicities in both the difficulty of course taken and course grade received depended on exposure to CT.

A concurrent study was conducted on the successes and challenges of program implementation with the teachers involved in the previous CT studies. The study took into account teachers’ levels of use and length of exposure to CT; the descriptive data comprised surveys, classroom observations, and interviews. The major challenges to implementation included a lack of access to resources, limited support for technology, and other technological difficulties. After 3 years of implementation, teachers reported that these initial barriers had been resolved; however teachers have yet to establish a fully collaborative classroom environment, as described in the Carnegie Learning implementation model.

Maui School District is the company’s first MeasureResults subscriber. A similar research initiative is being conducted at the community college level with The Maui Educational Consortium. The report for this study will be announced later this year.

2008-12-10
Archive